The SECOS Garden Bird Survey is open to SECOS members and non-members. The survey period covers the 38 years from the 1985-86 season to the 2022-23 season. Each season covers 26 weeks from October to March.
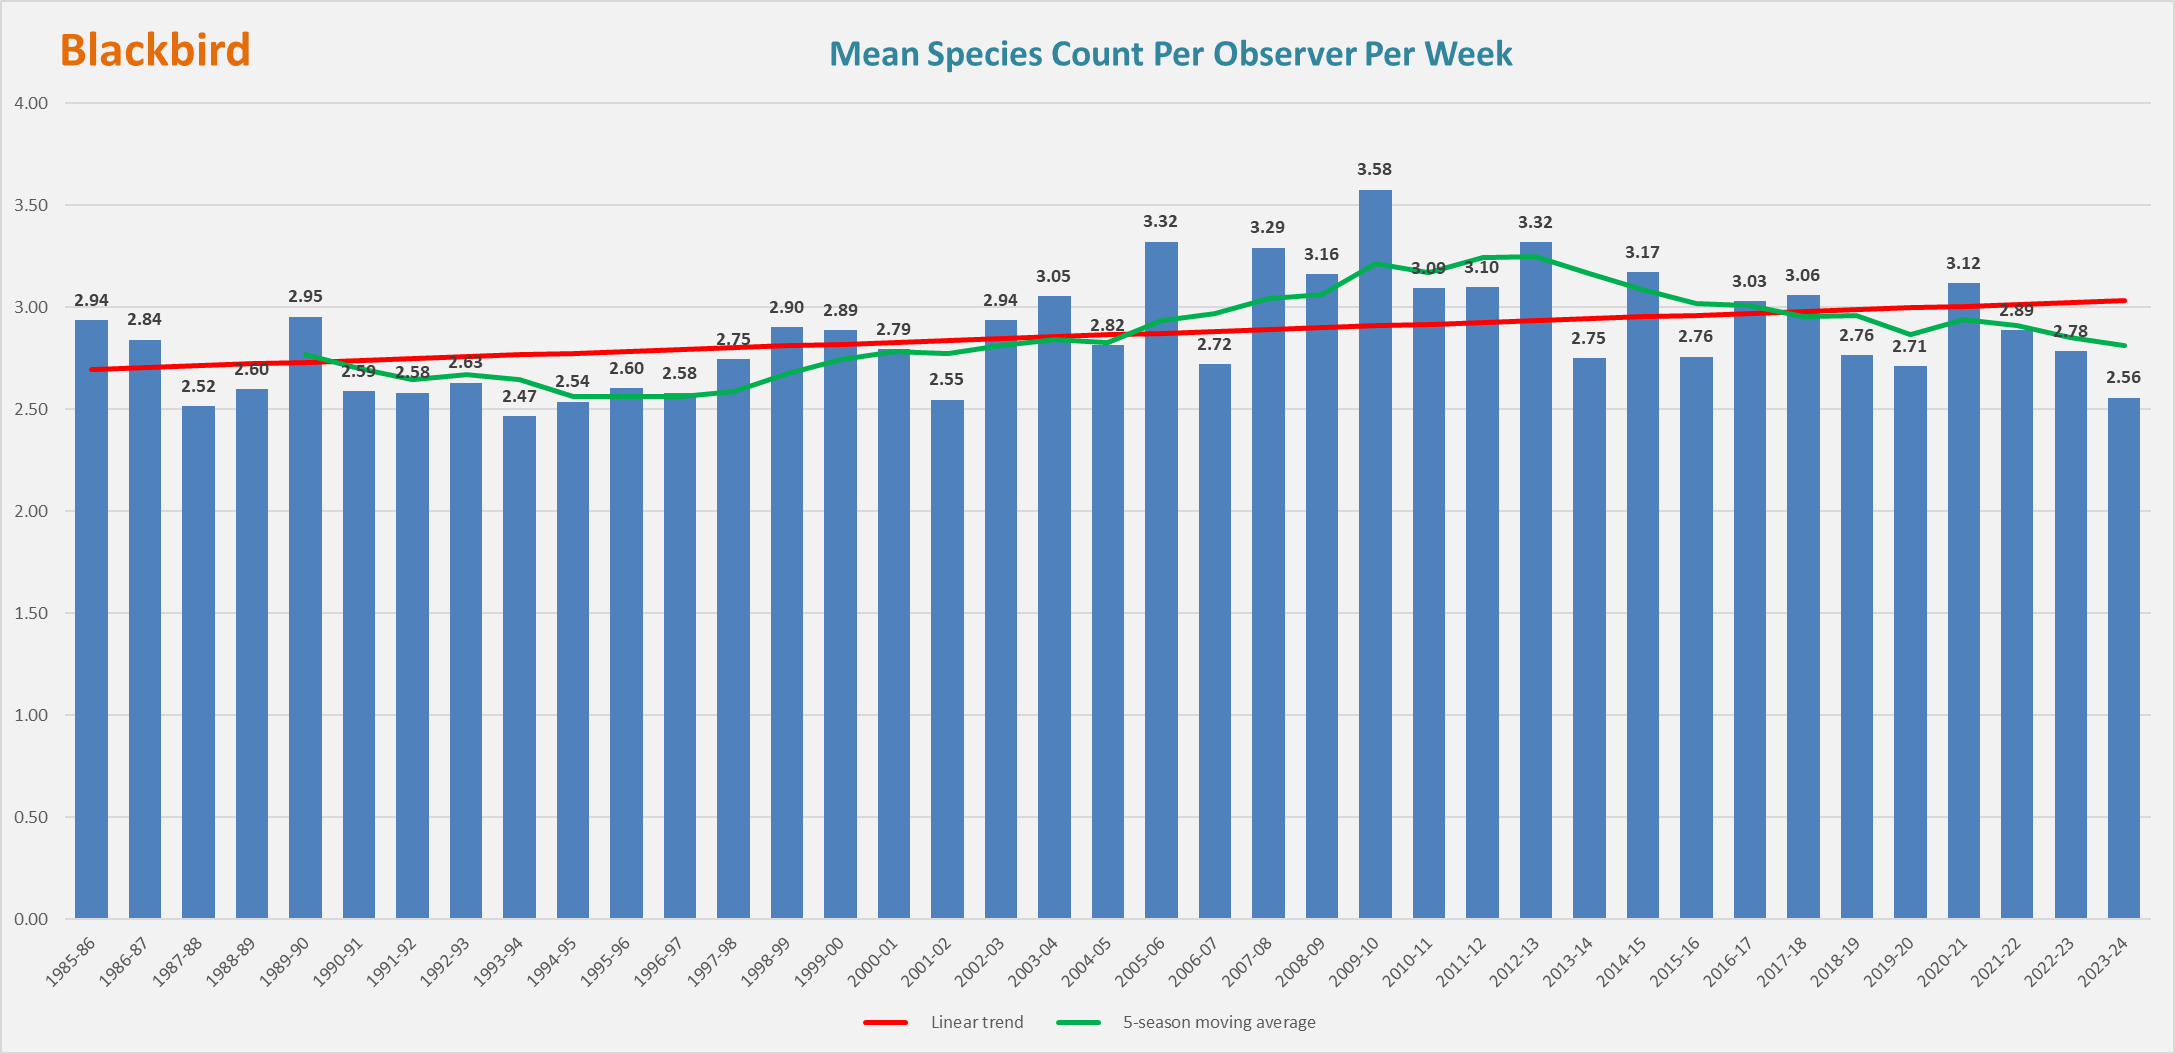
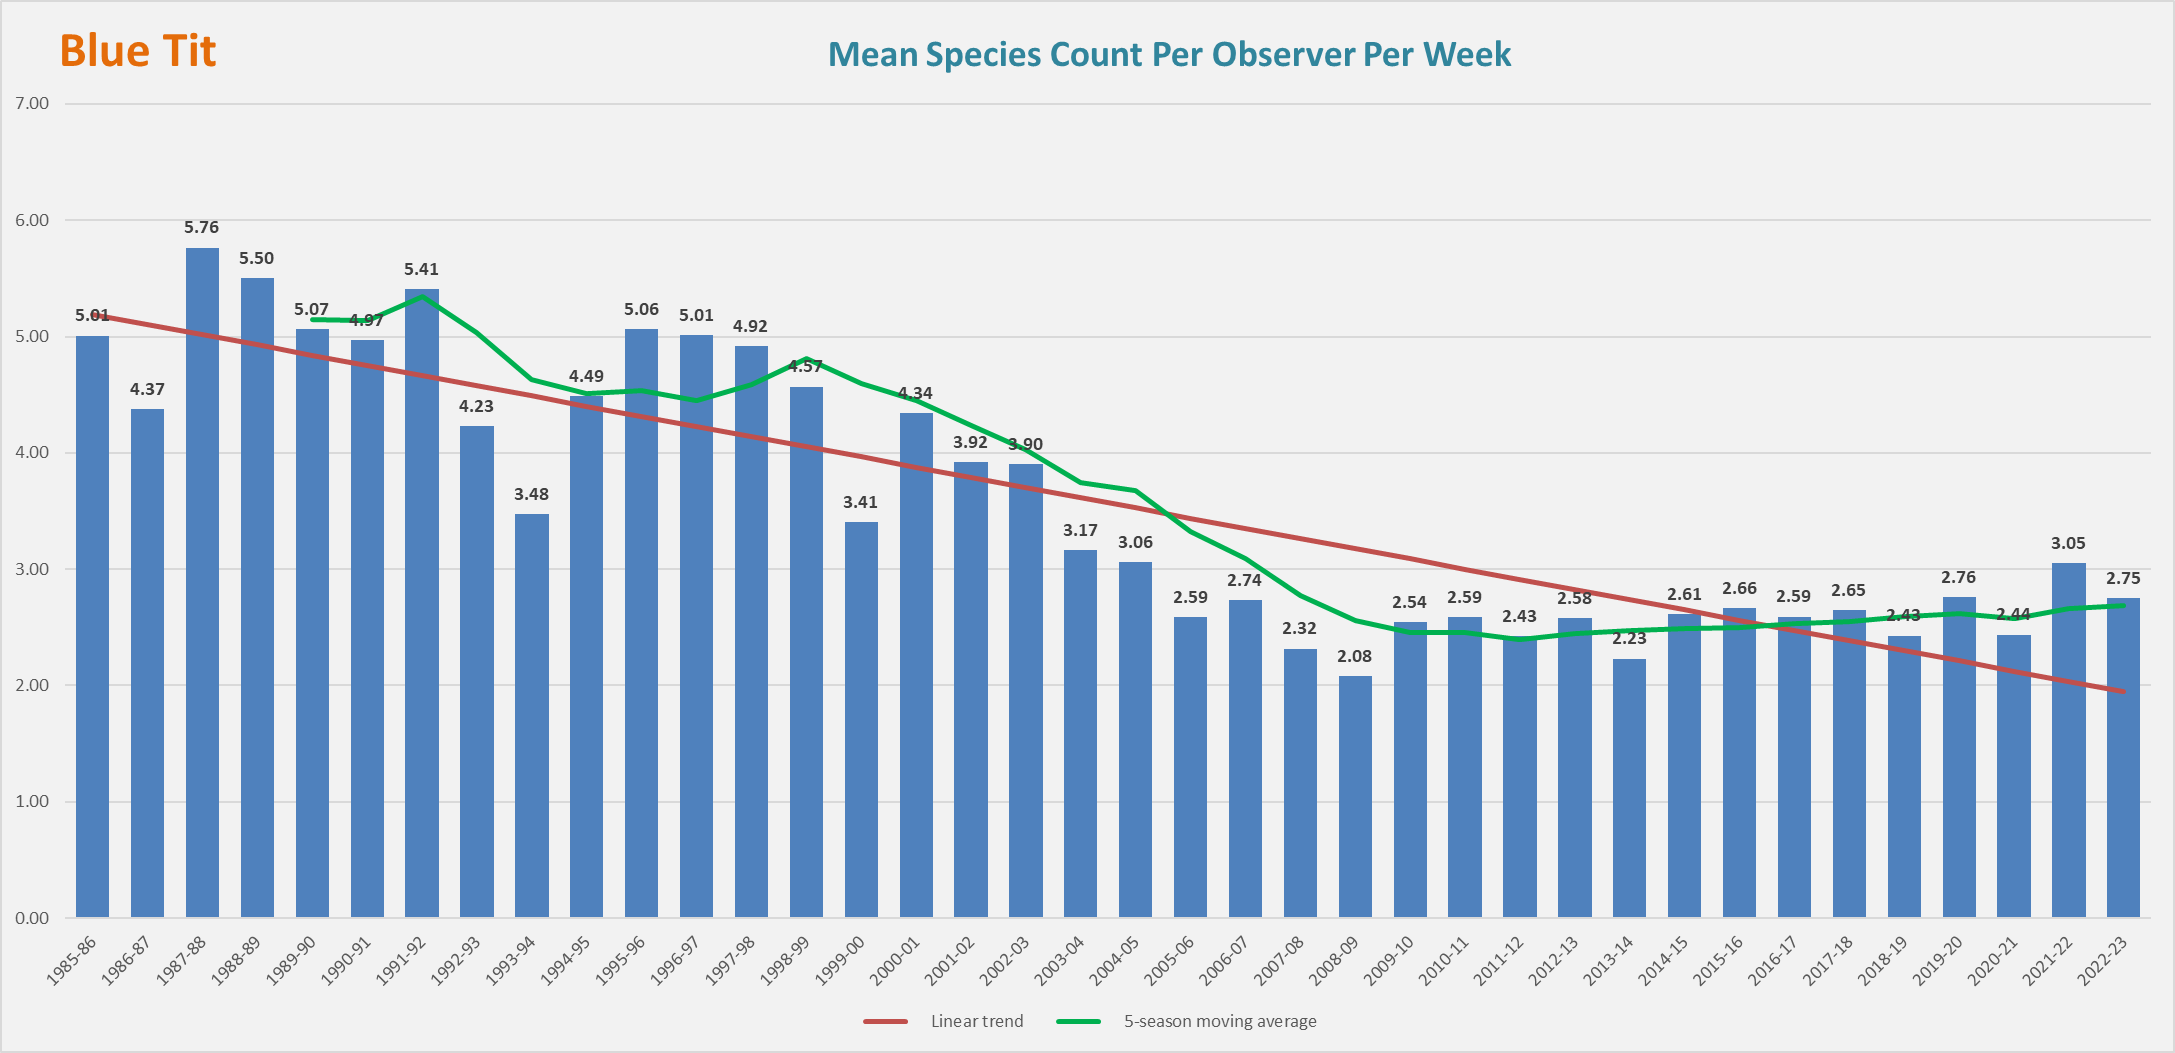
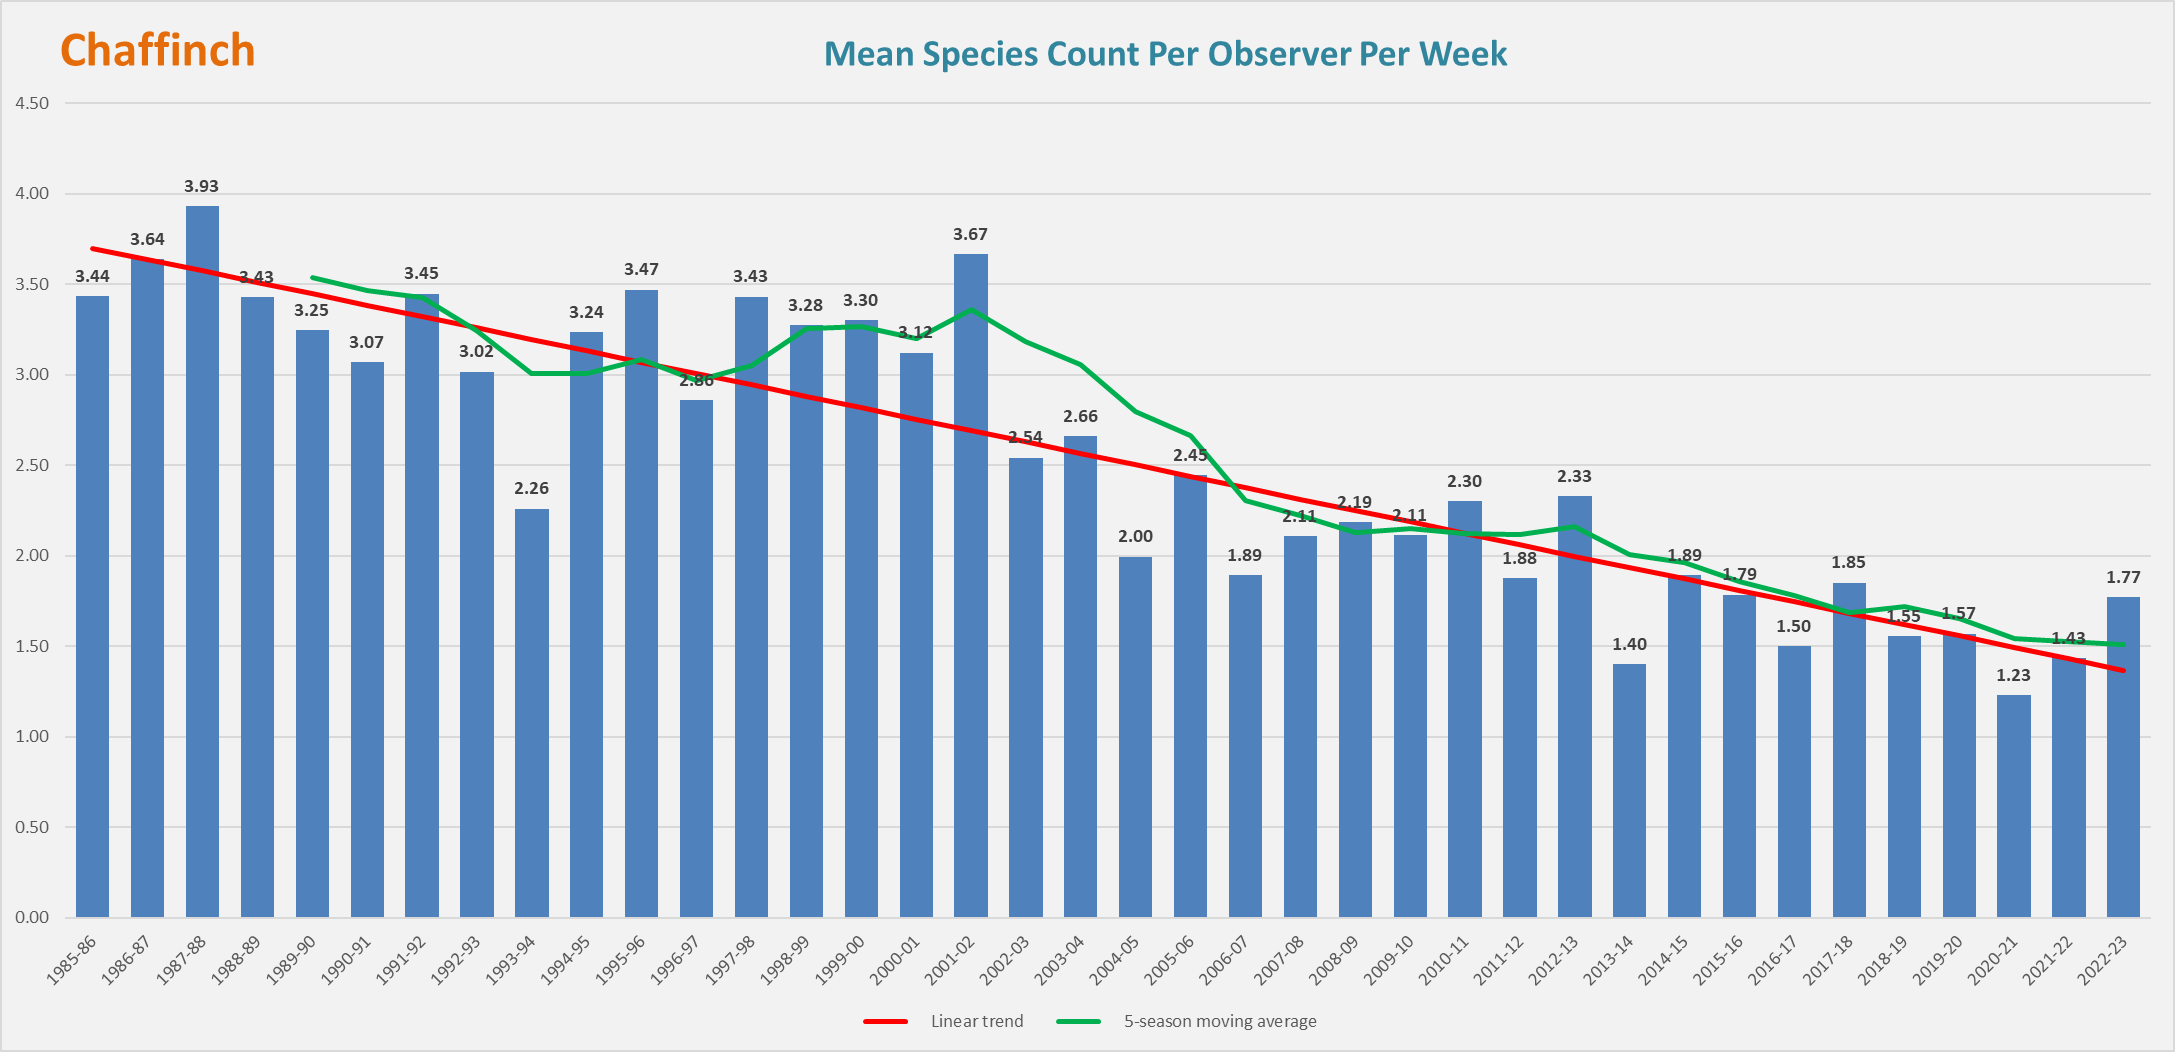
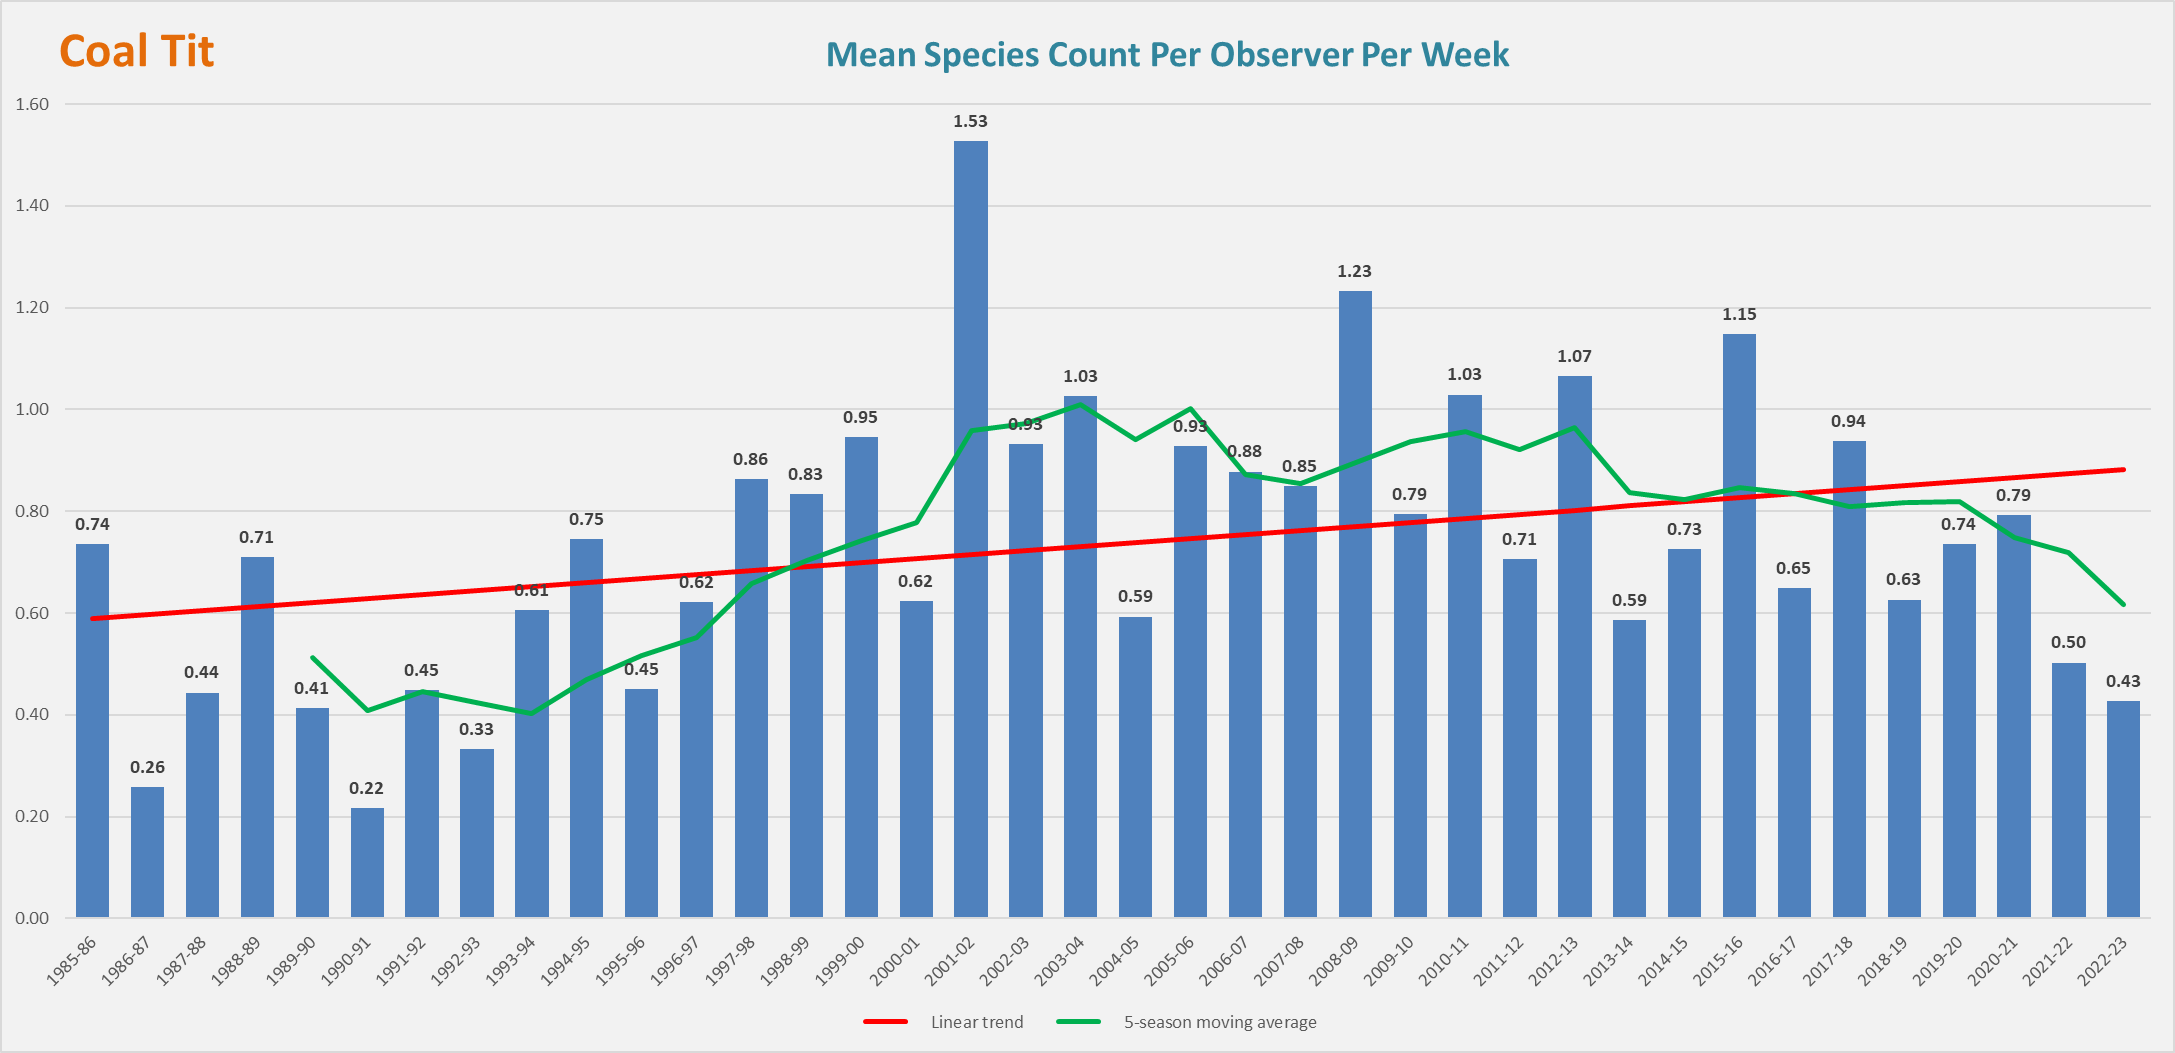
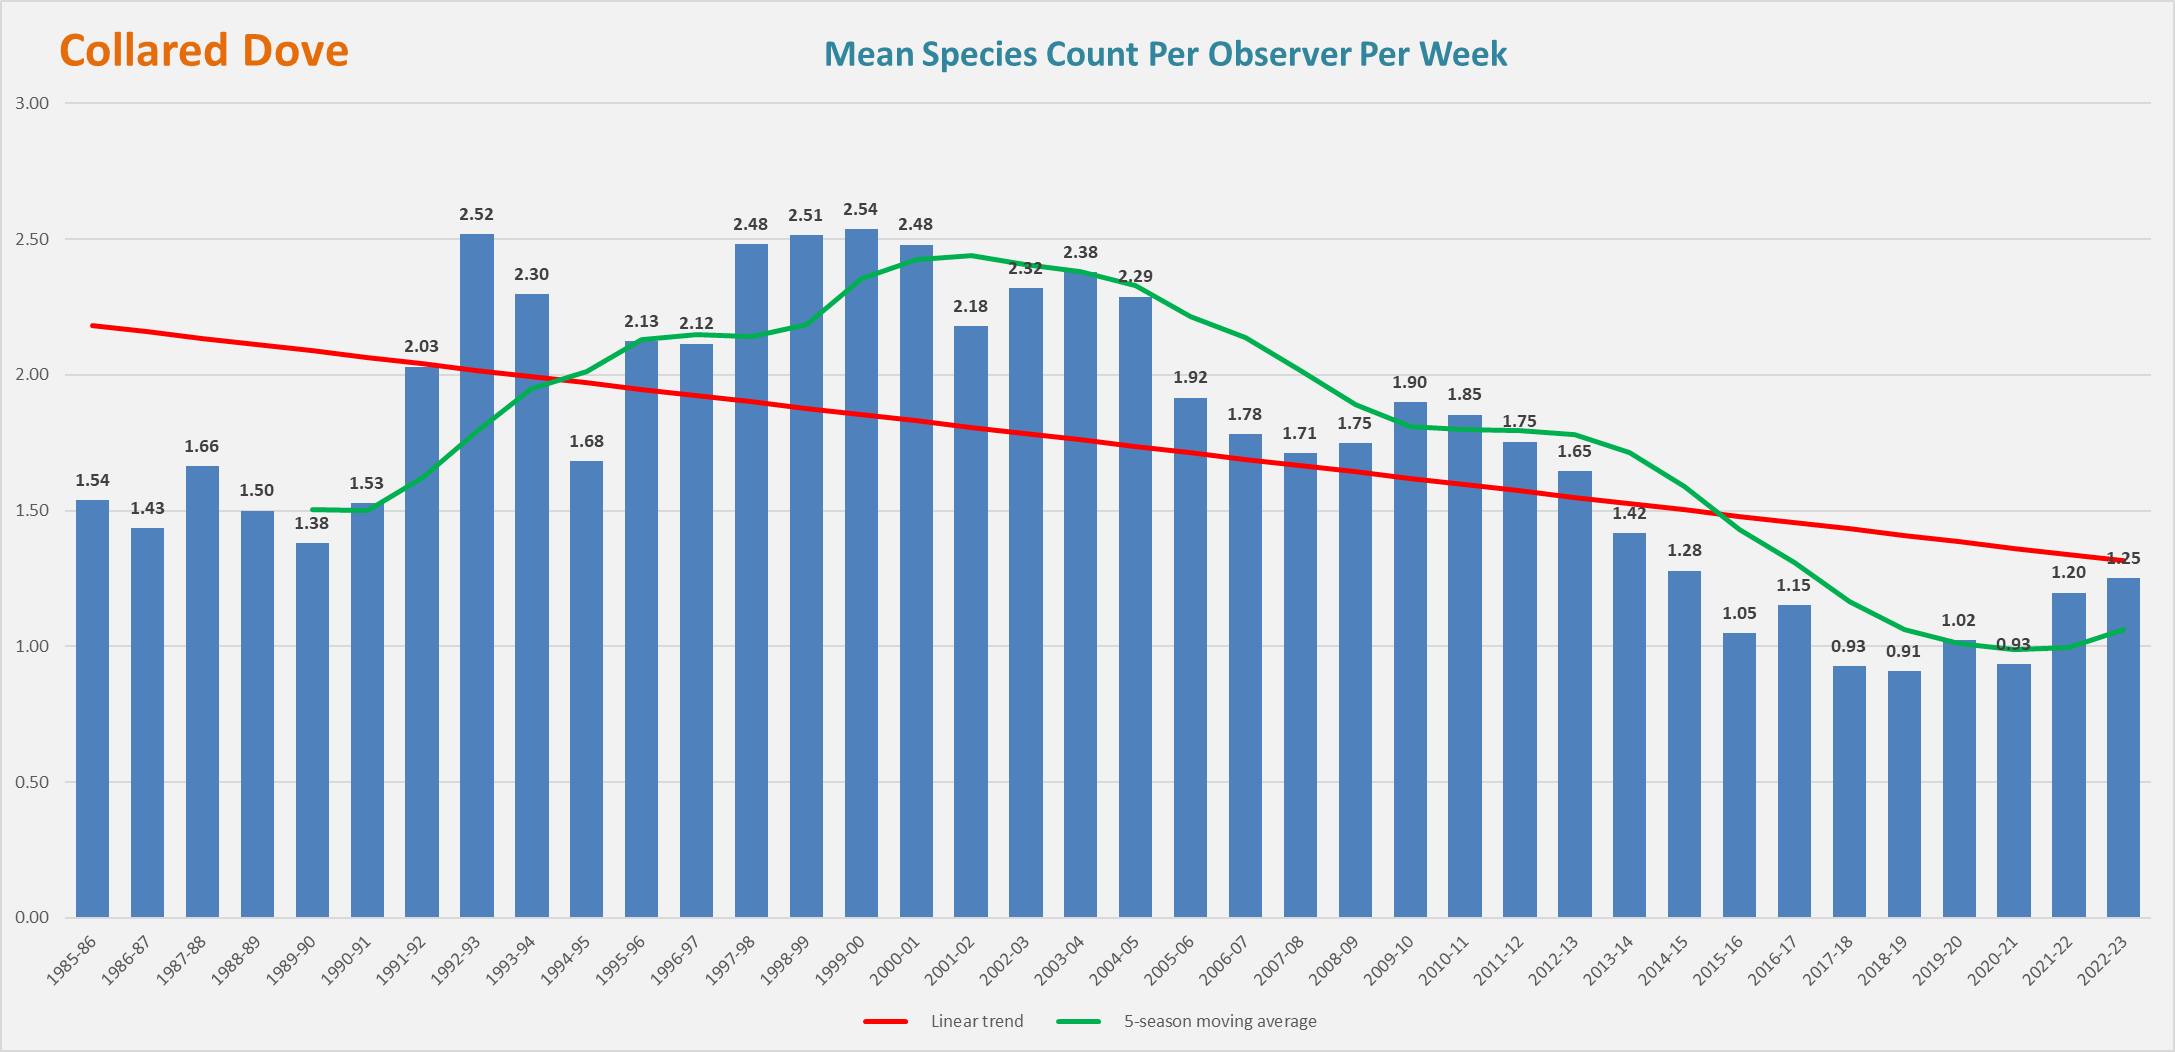
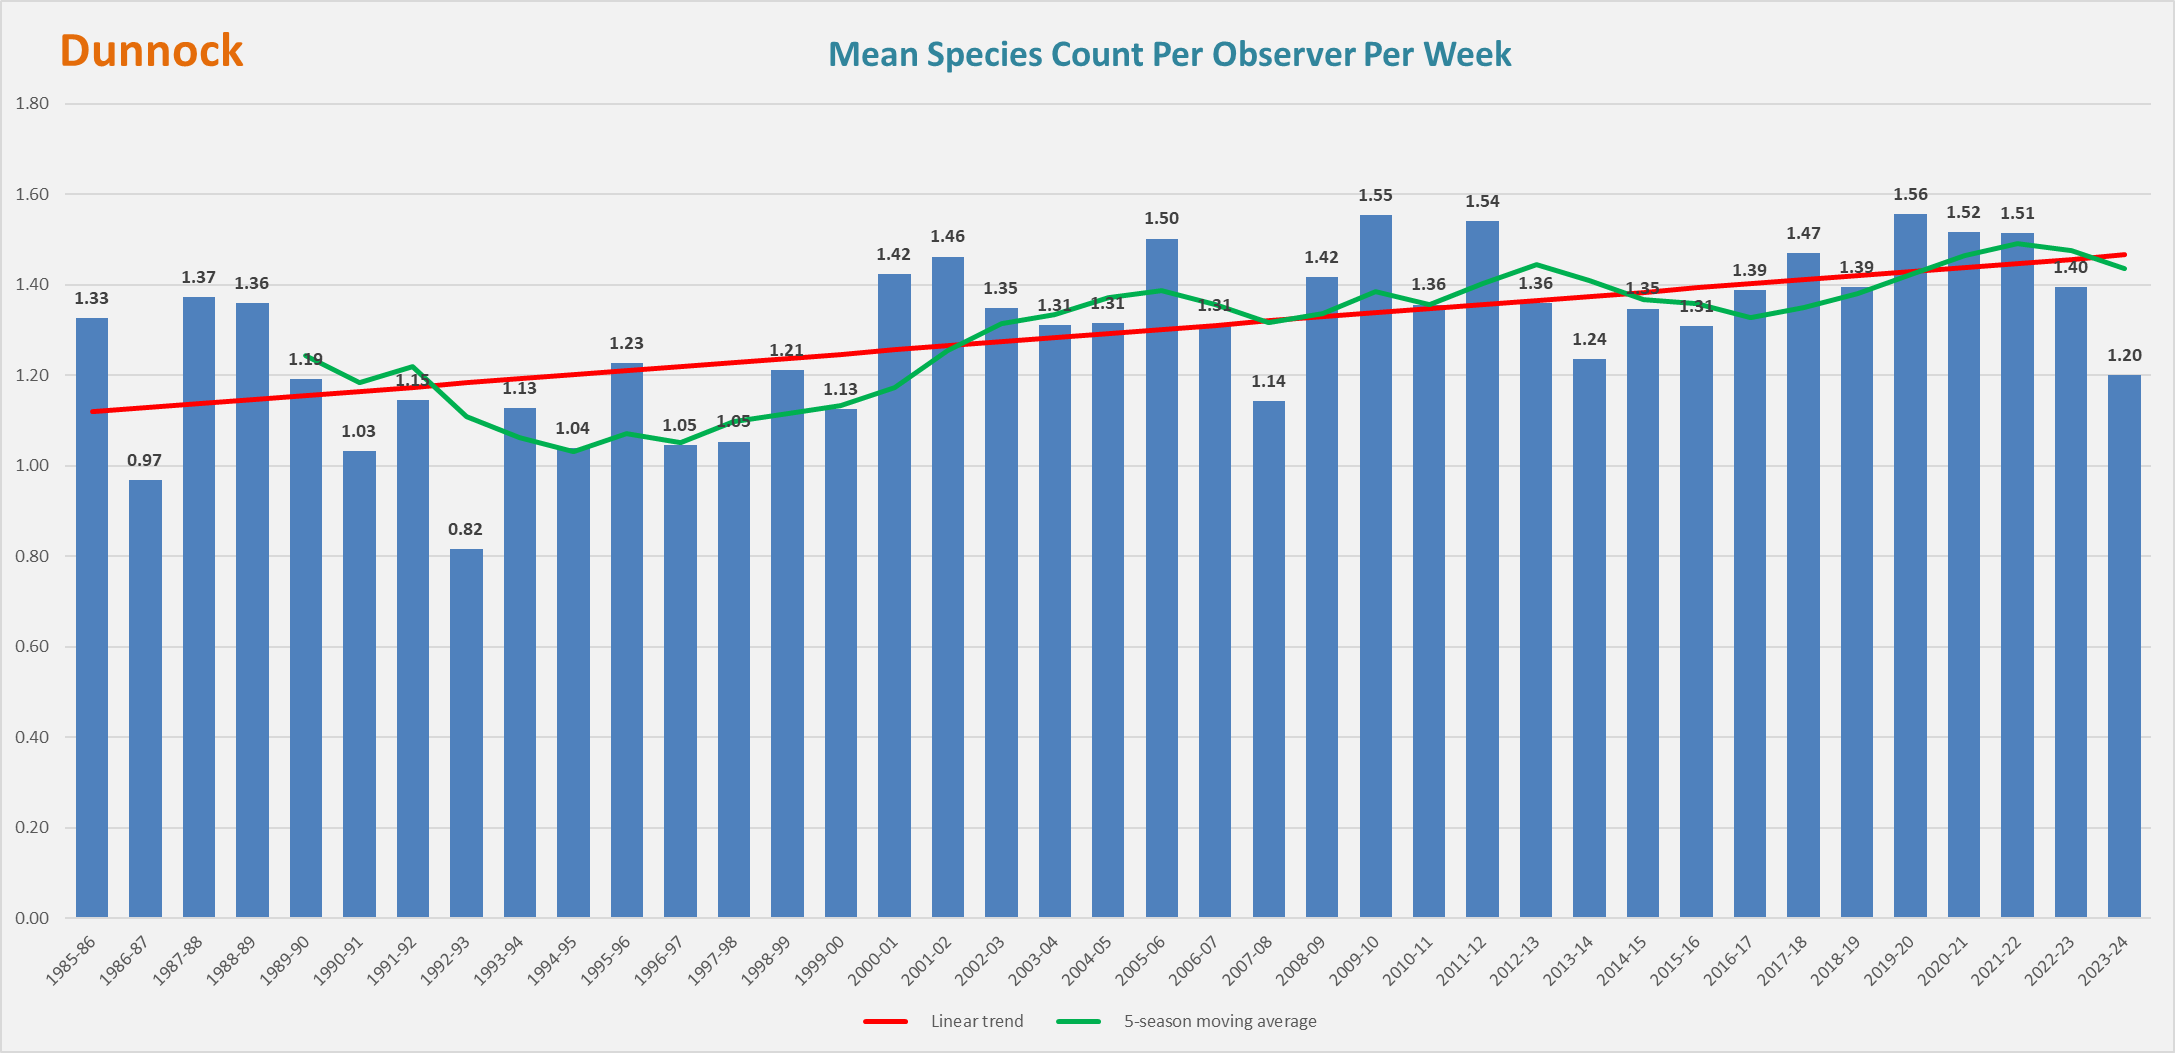
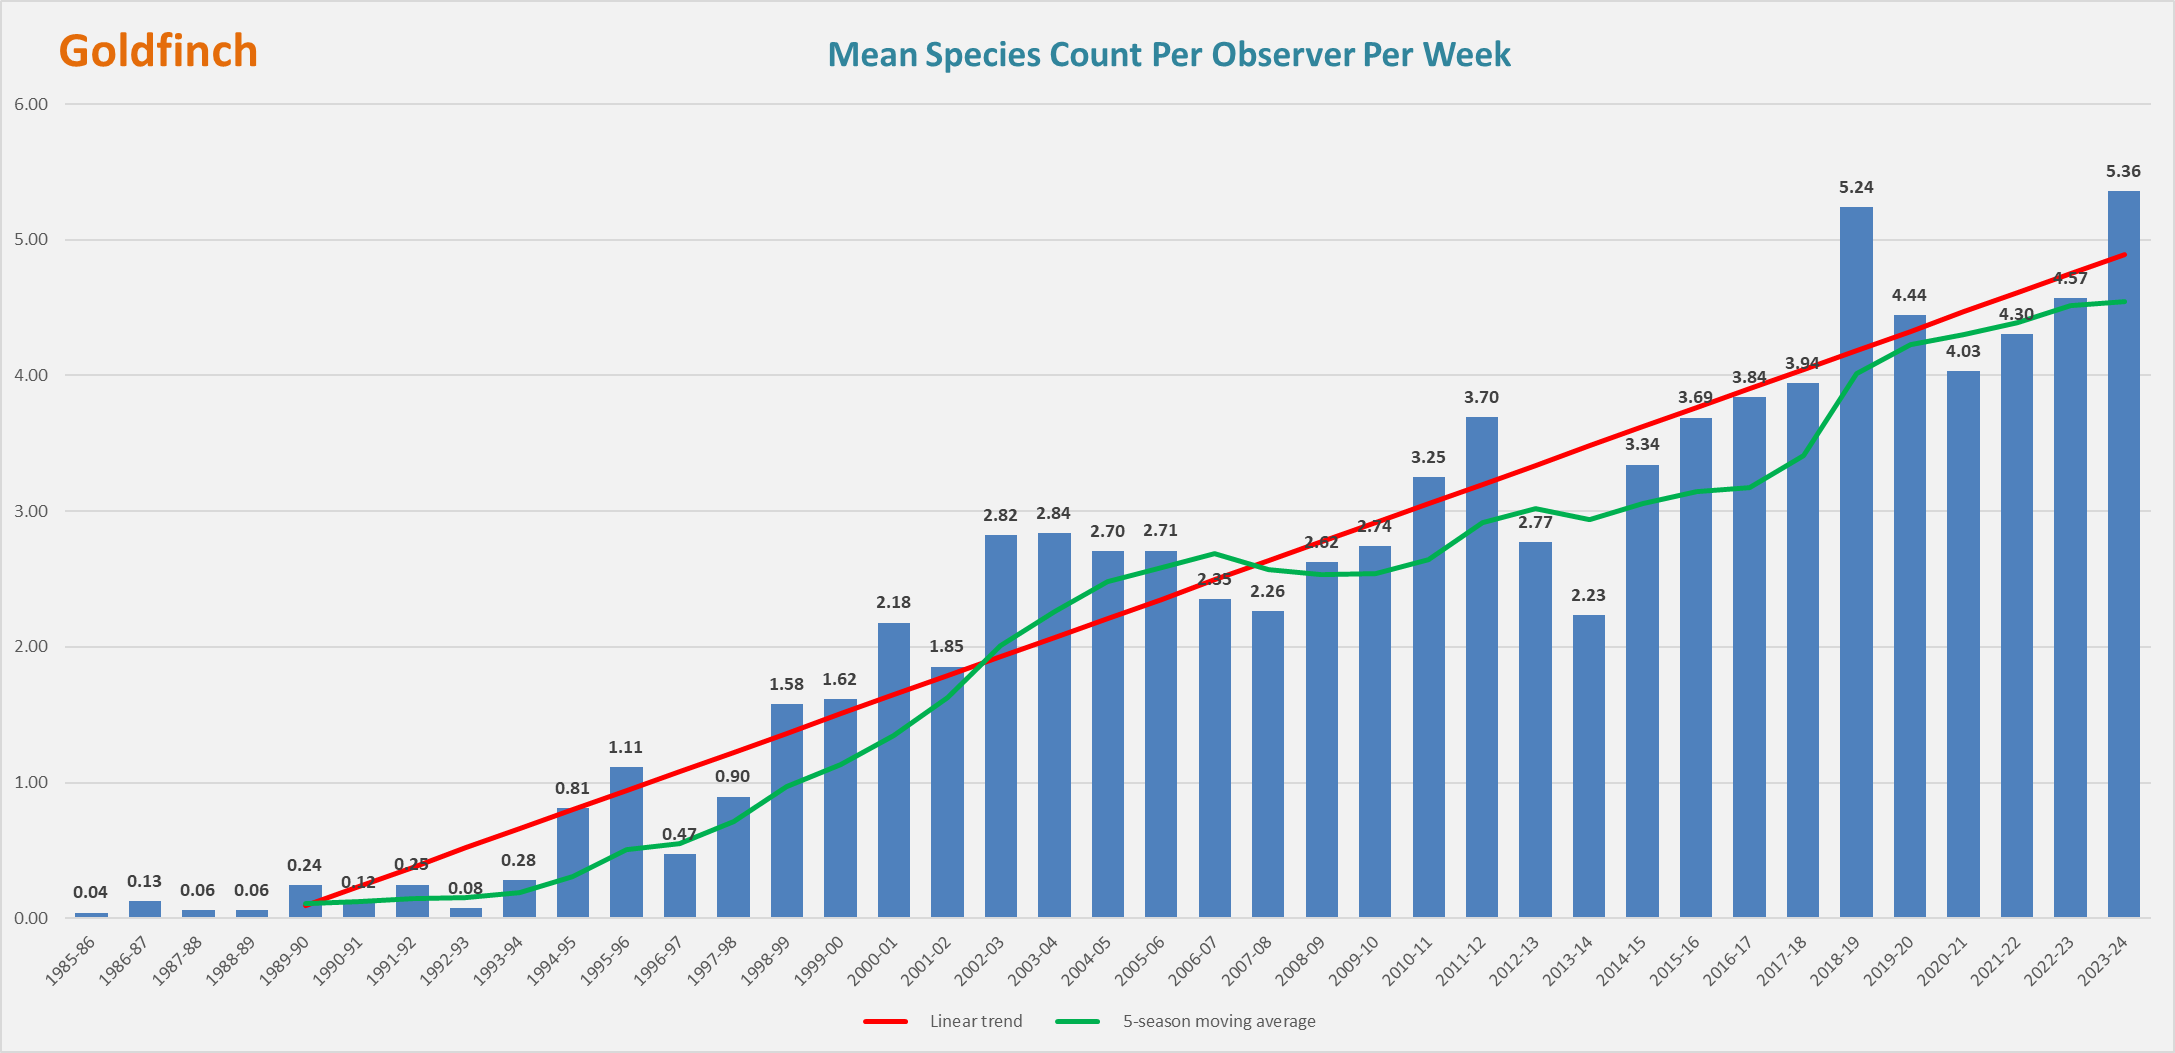
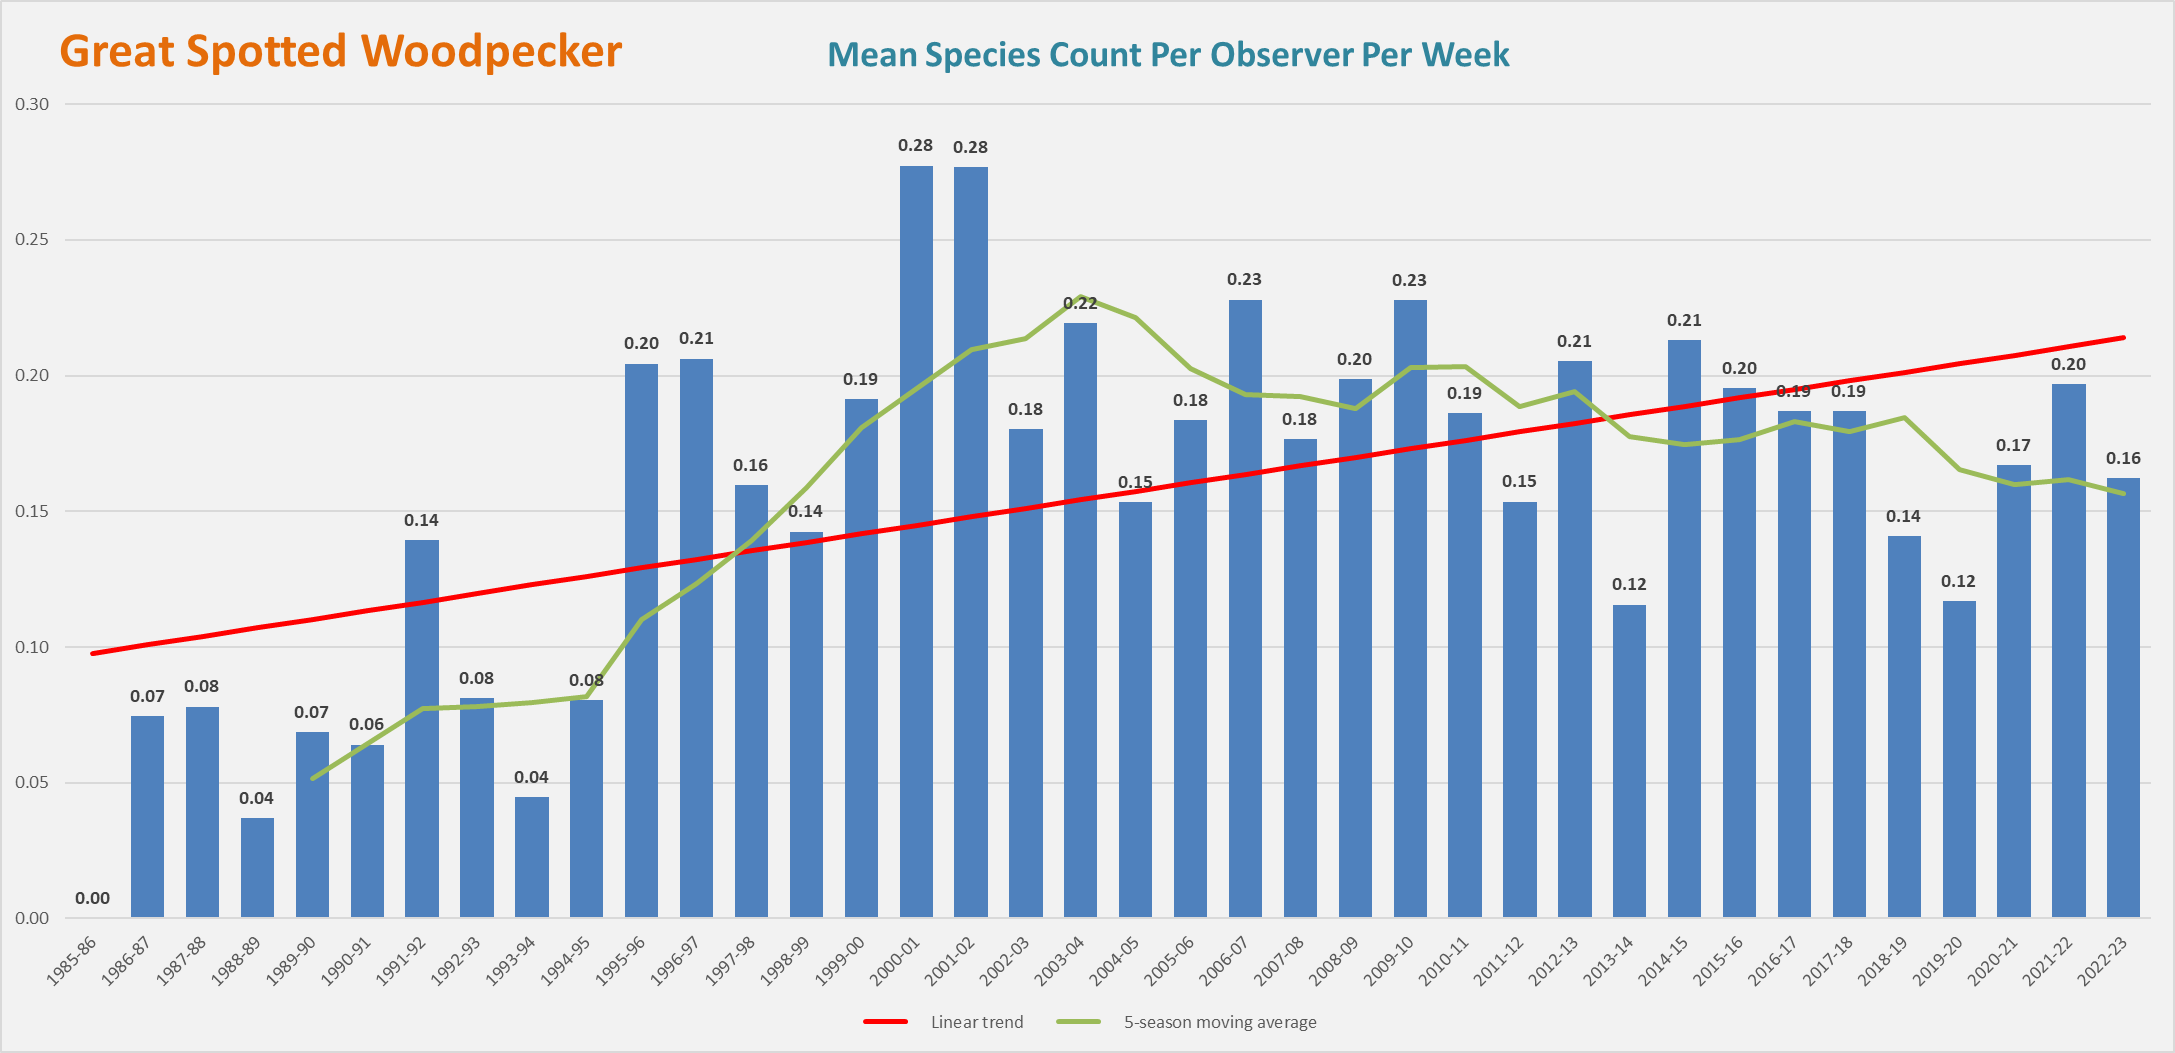
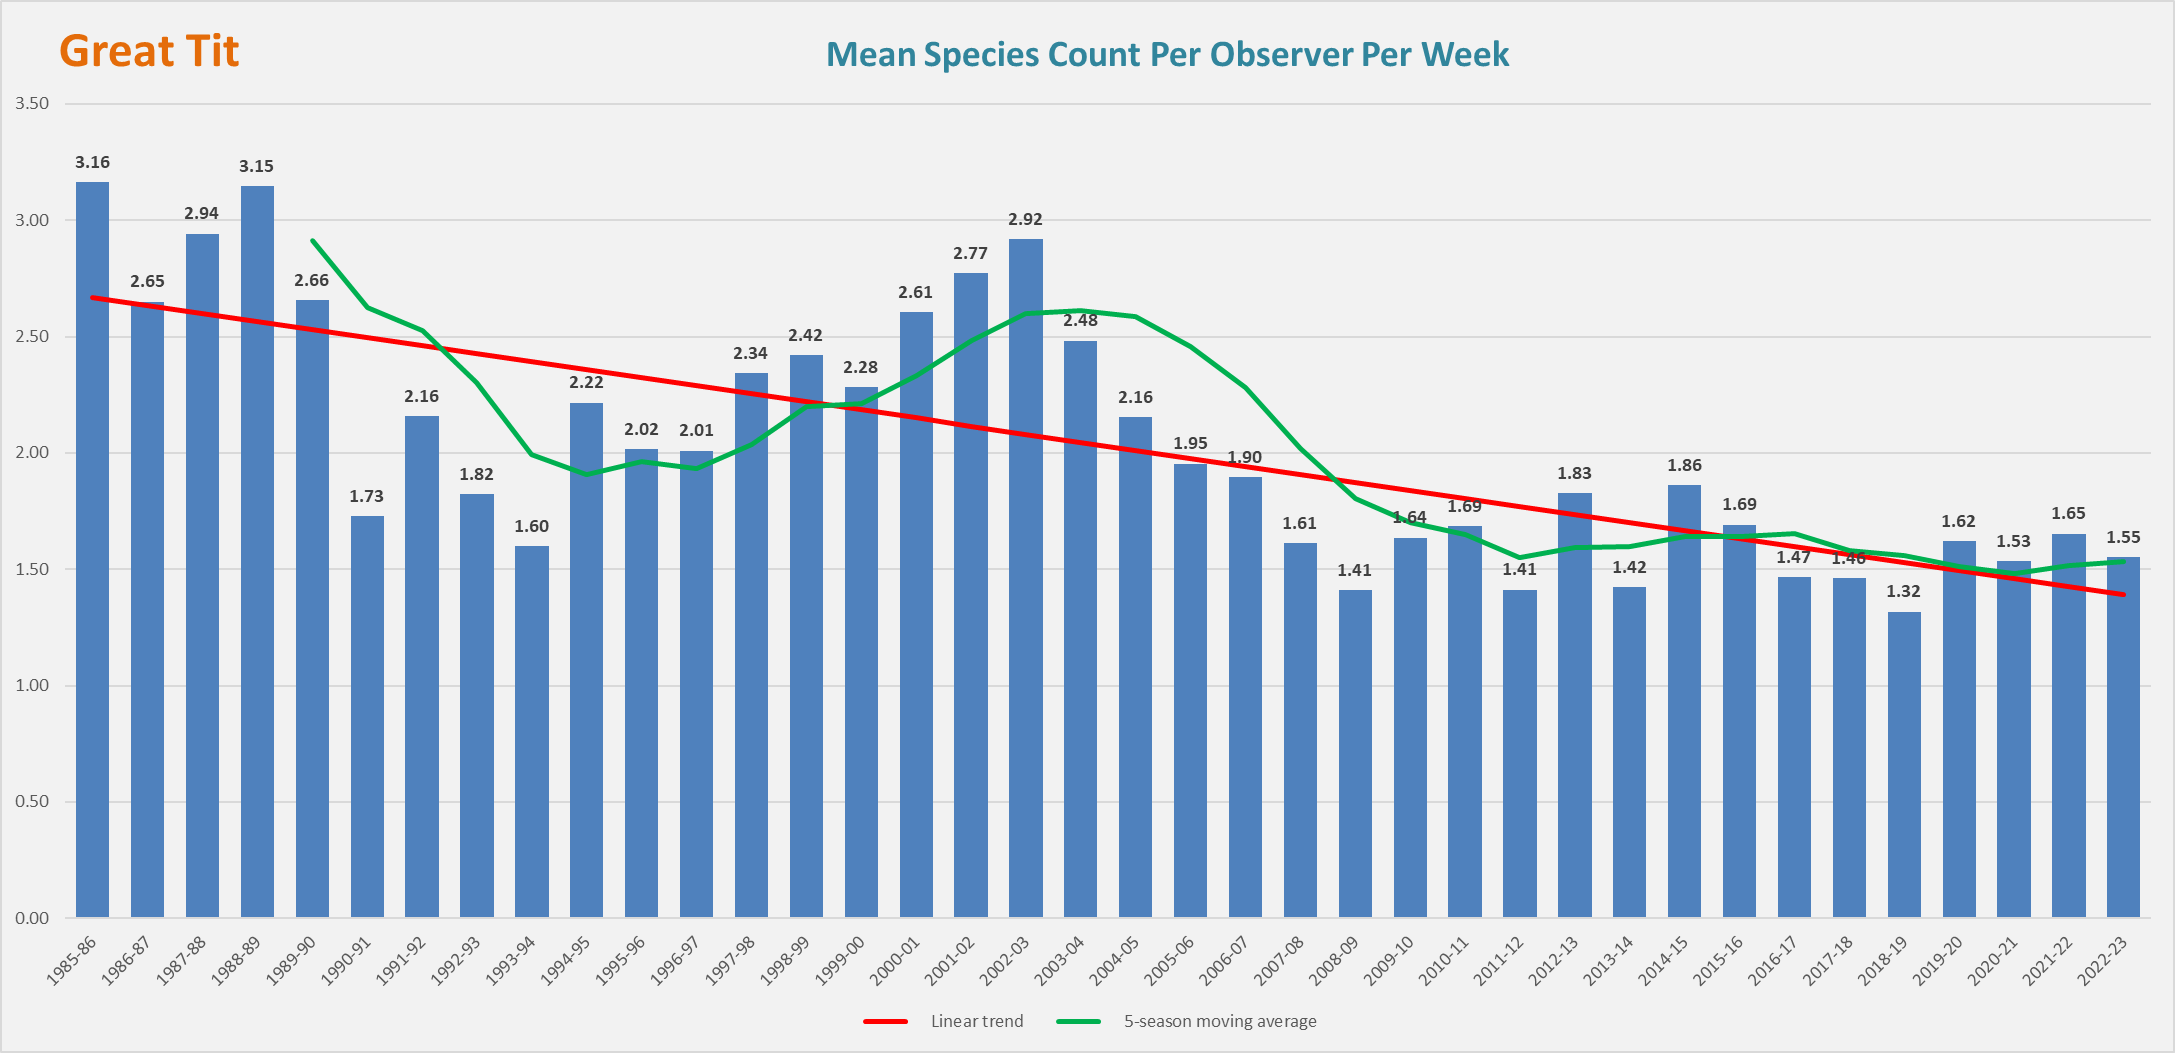
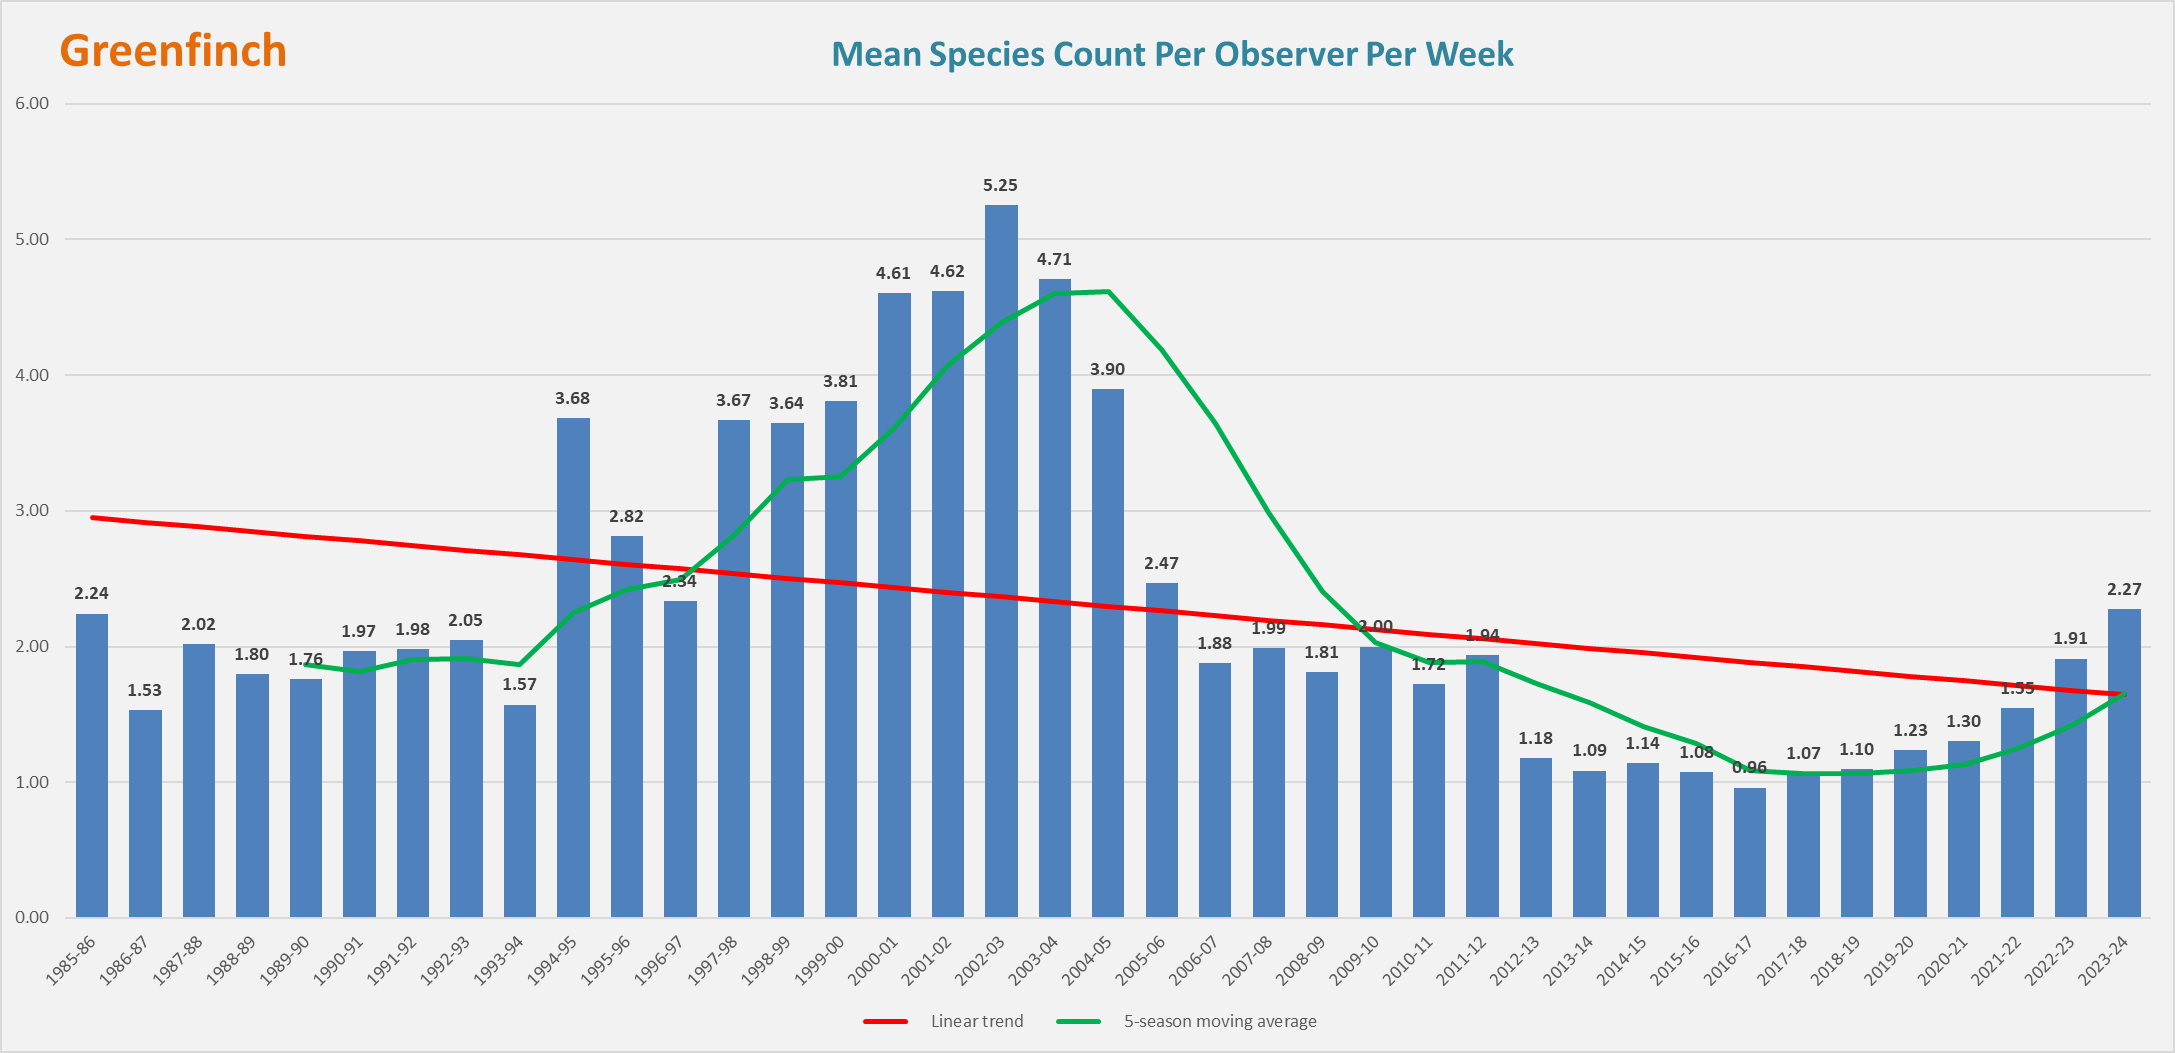
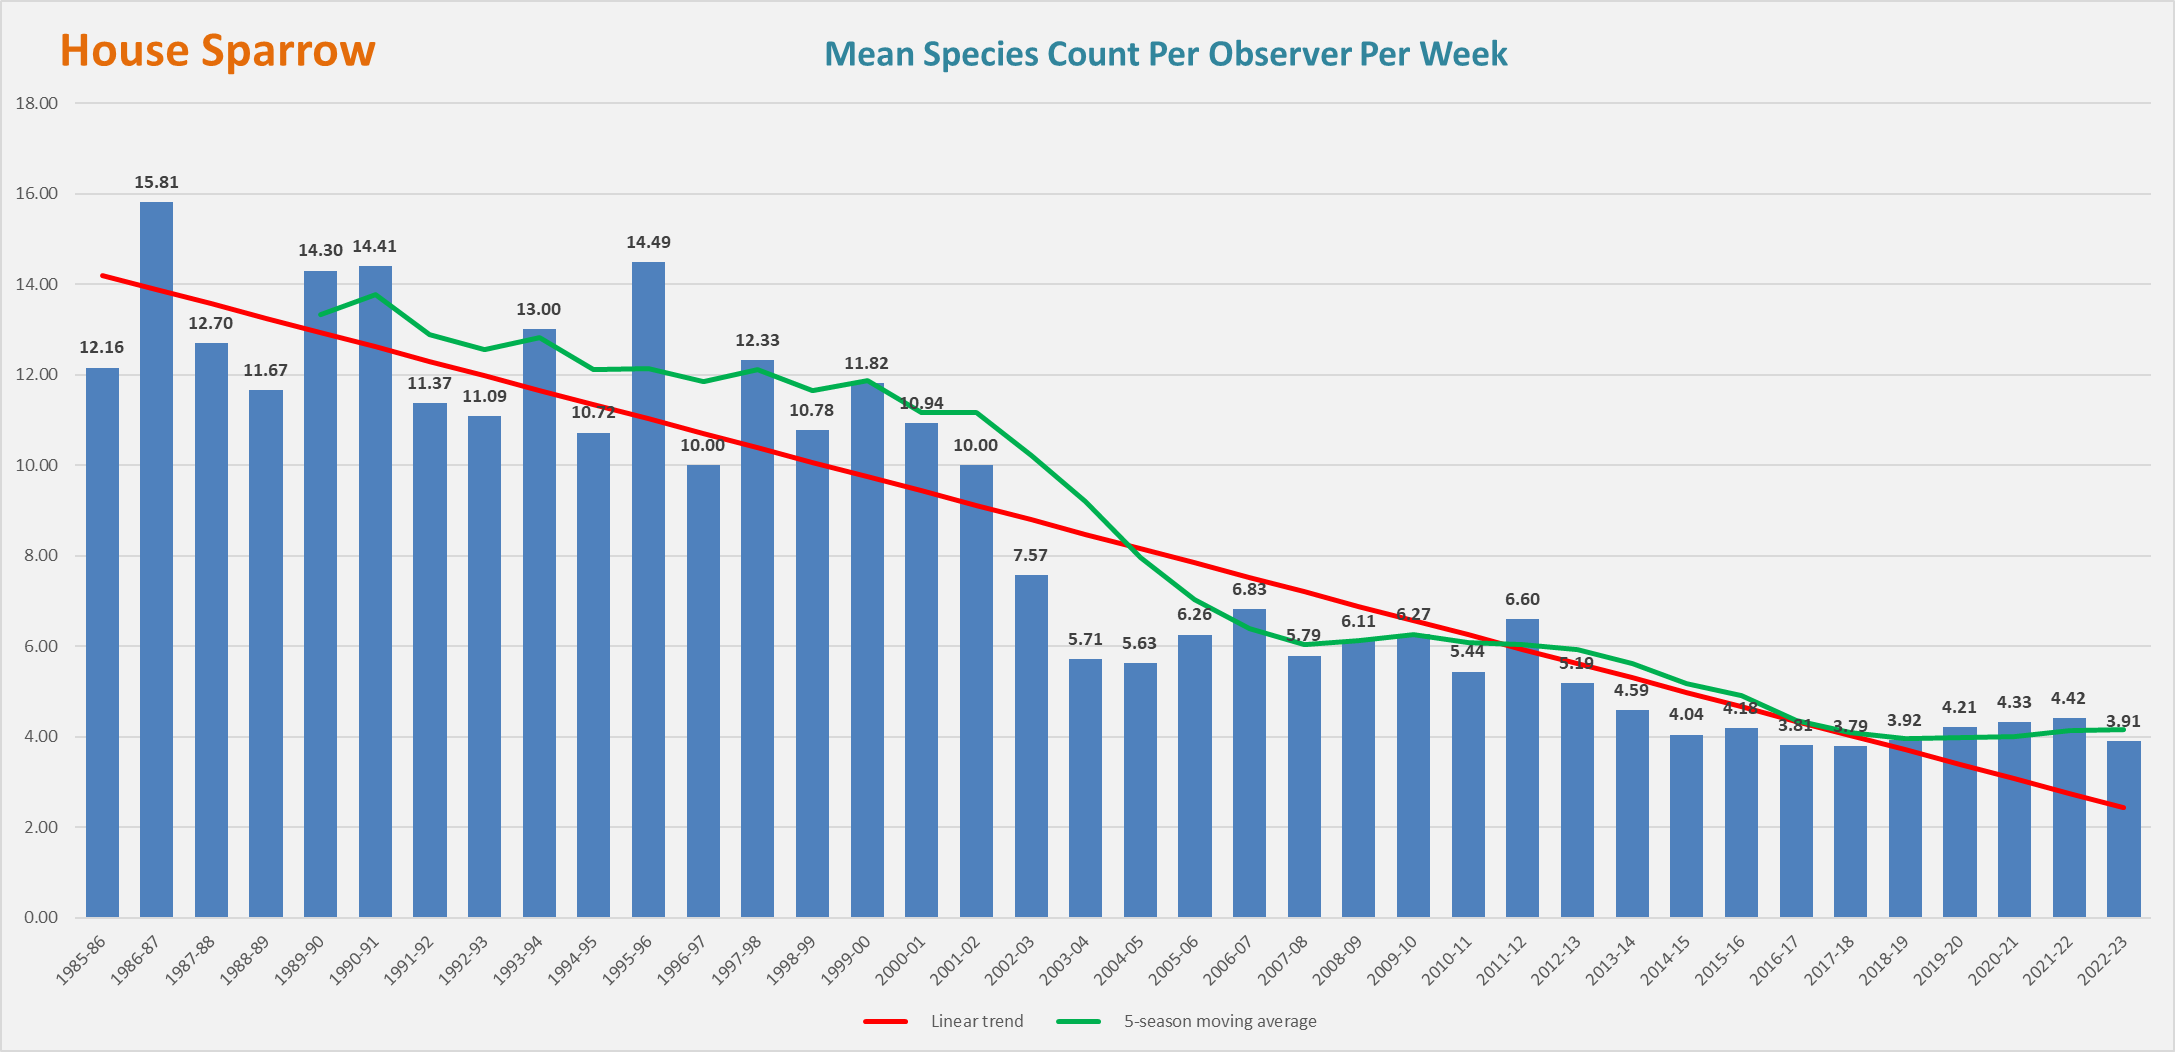
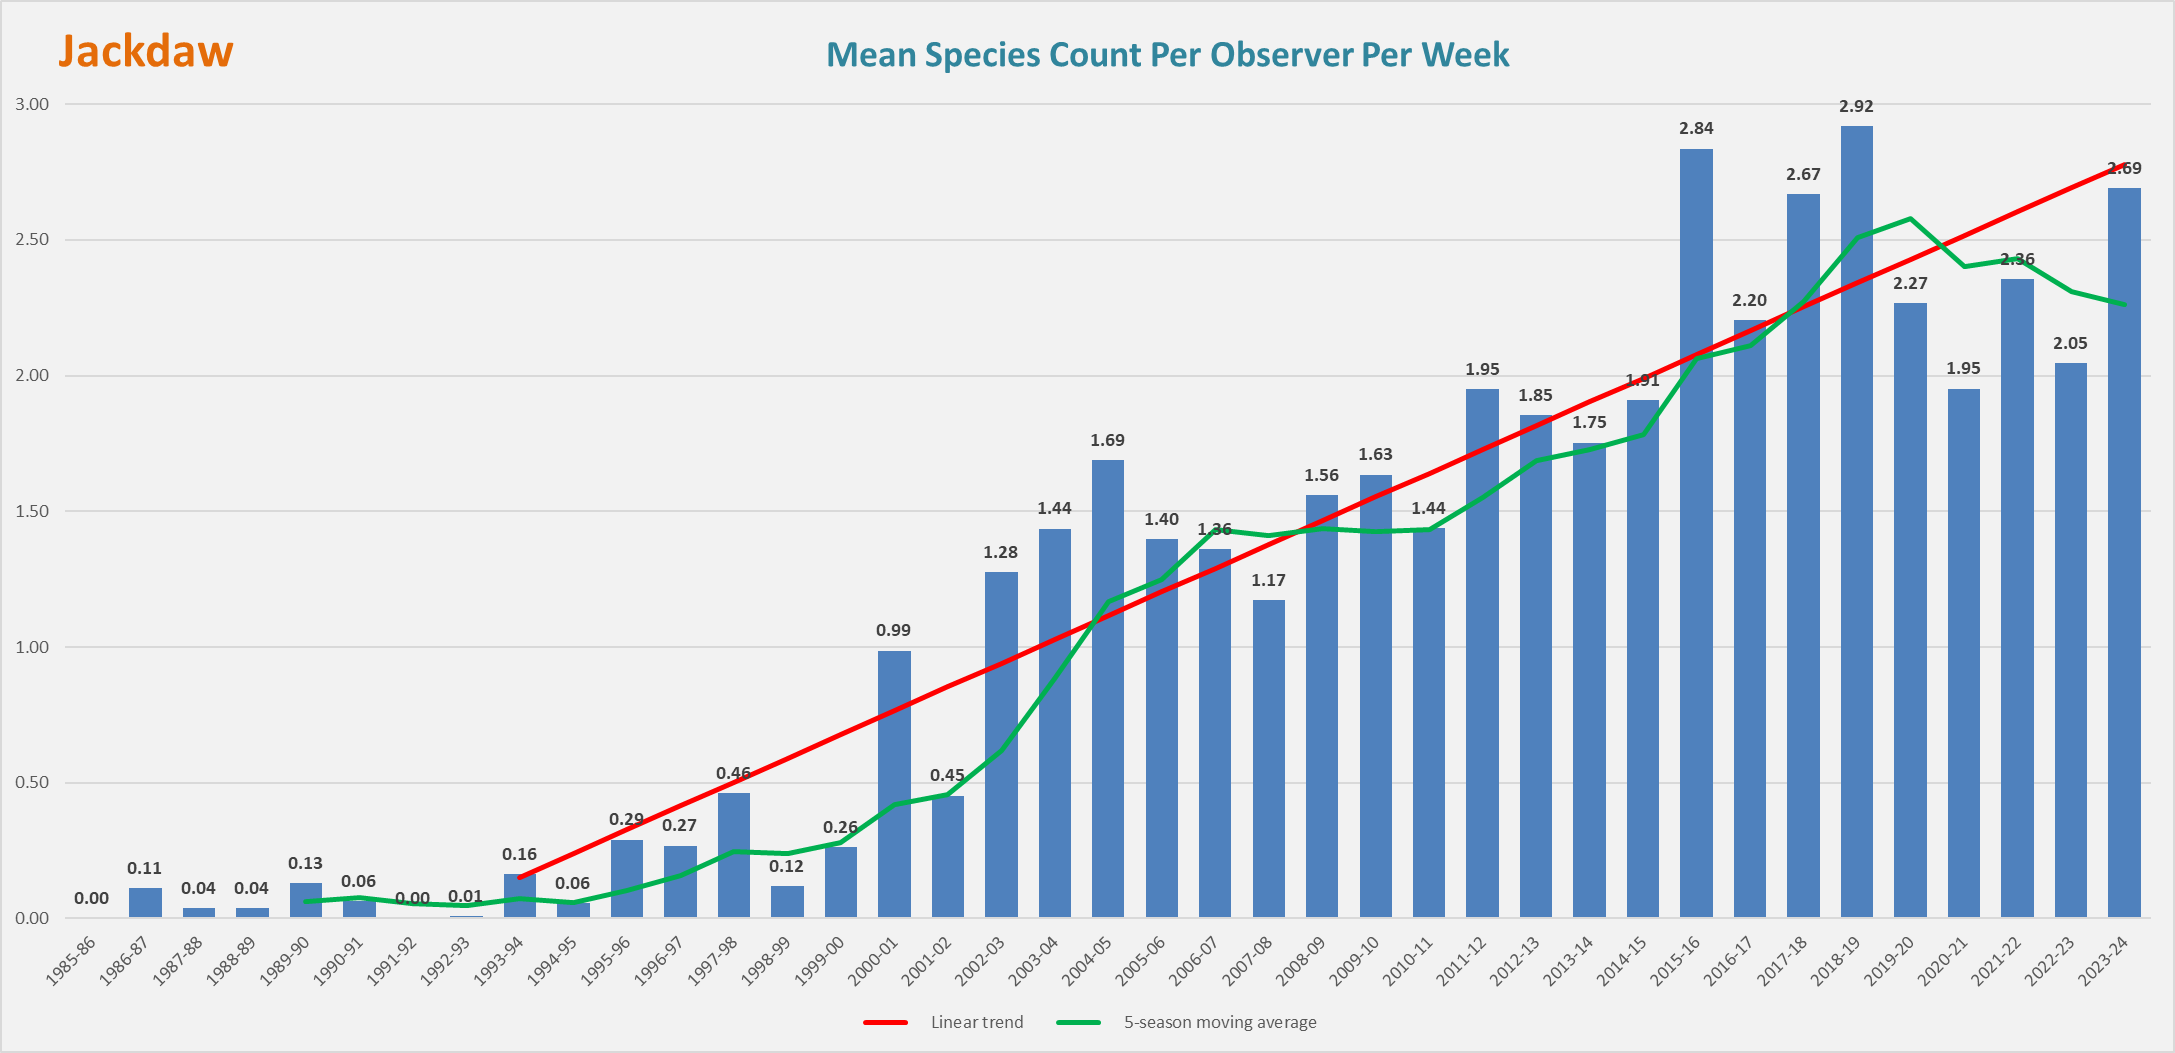
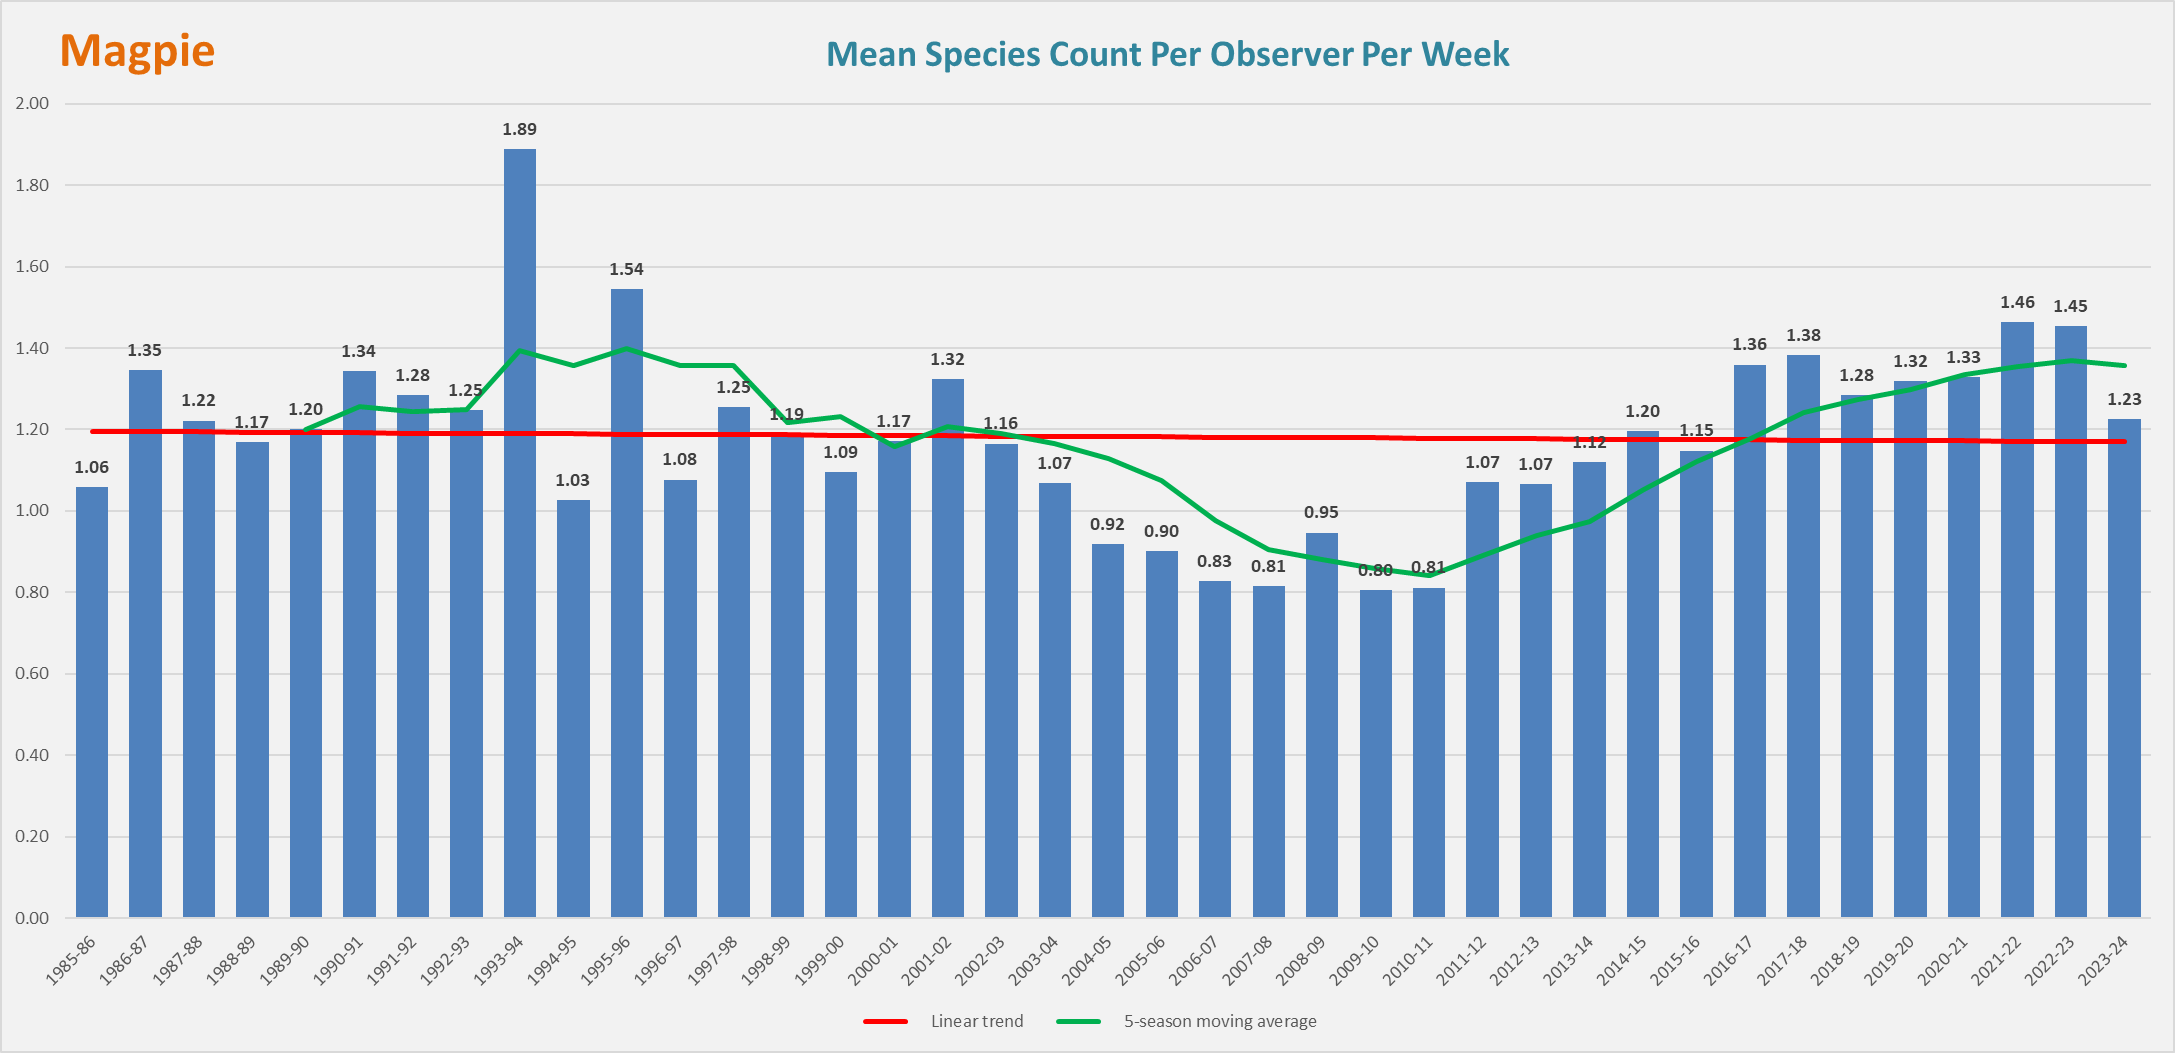
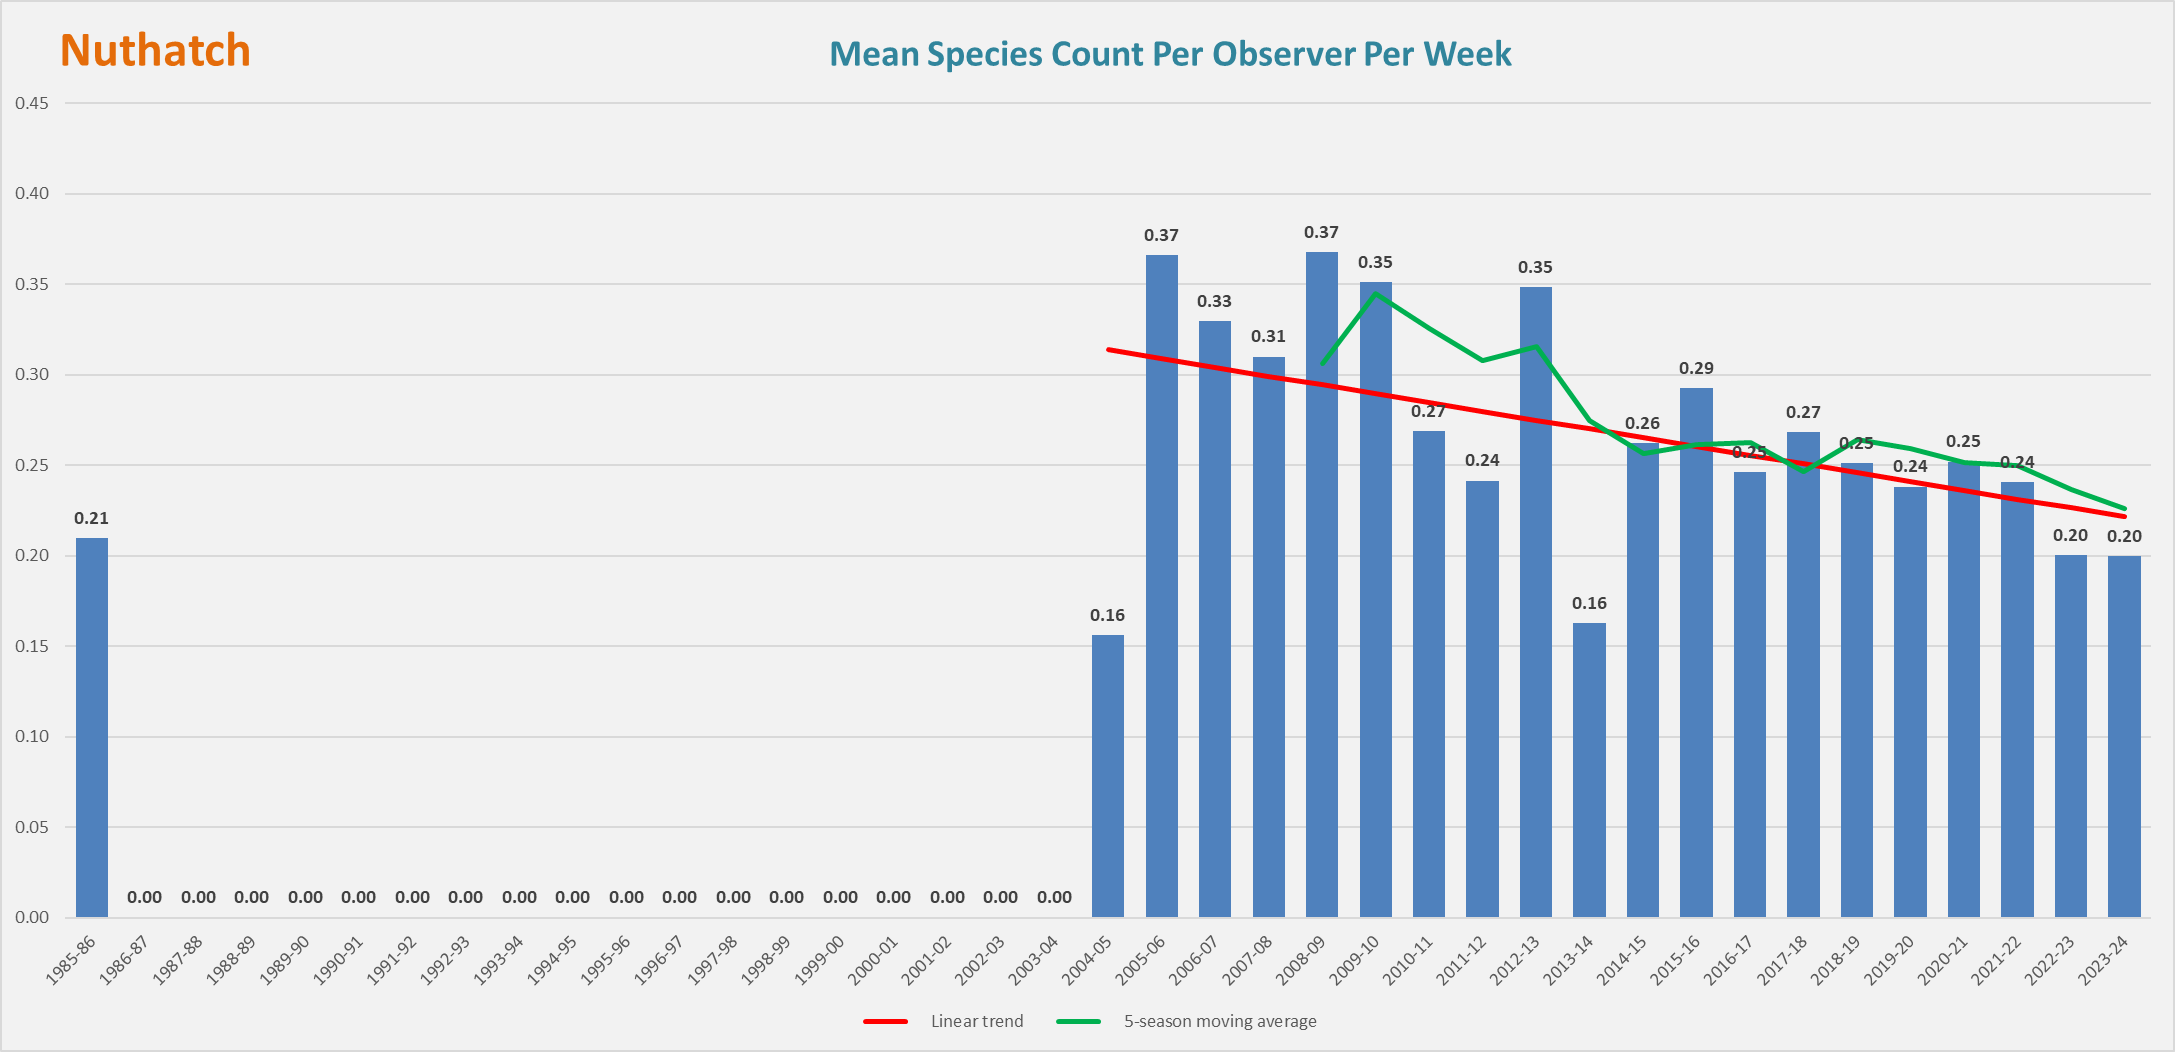
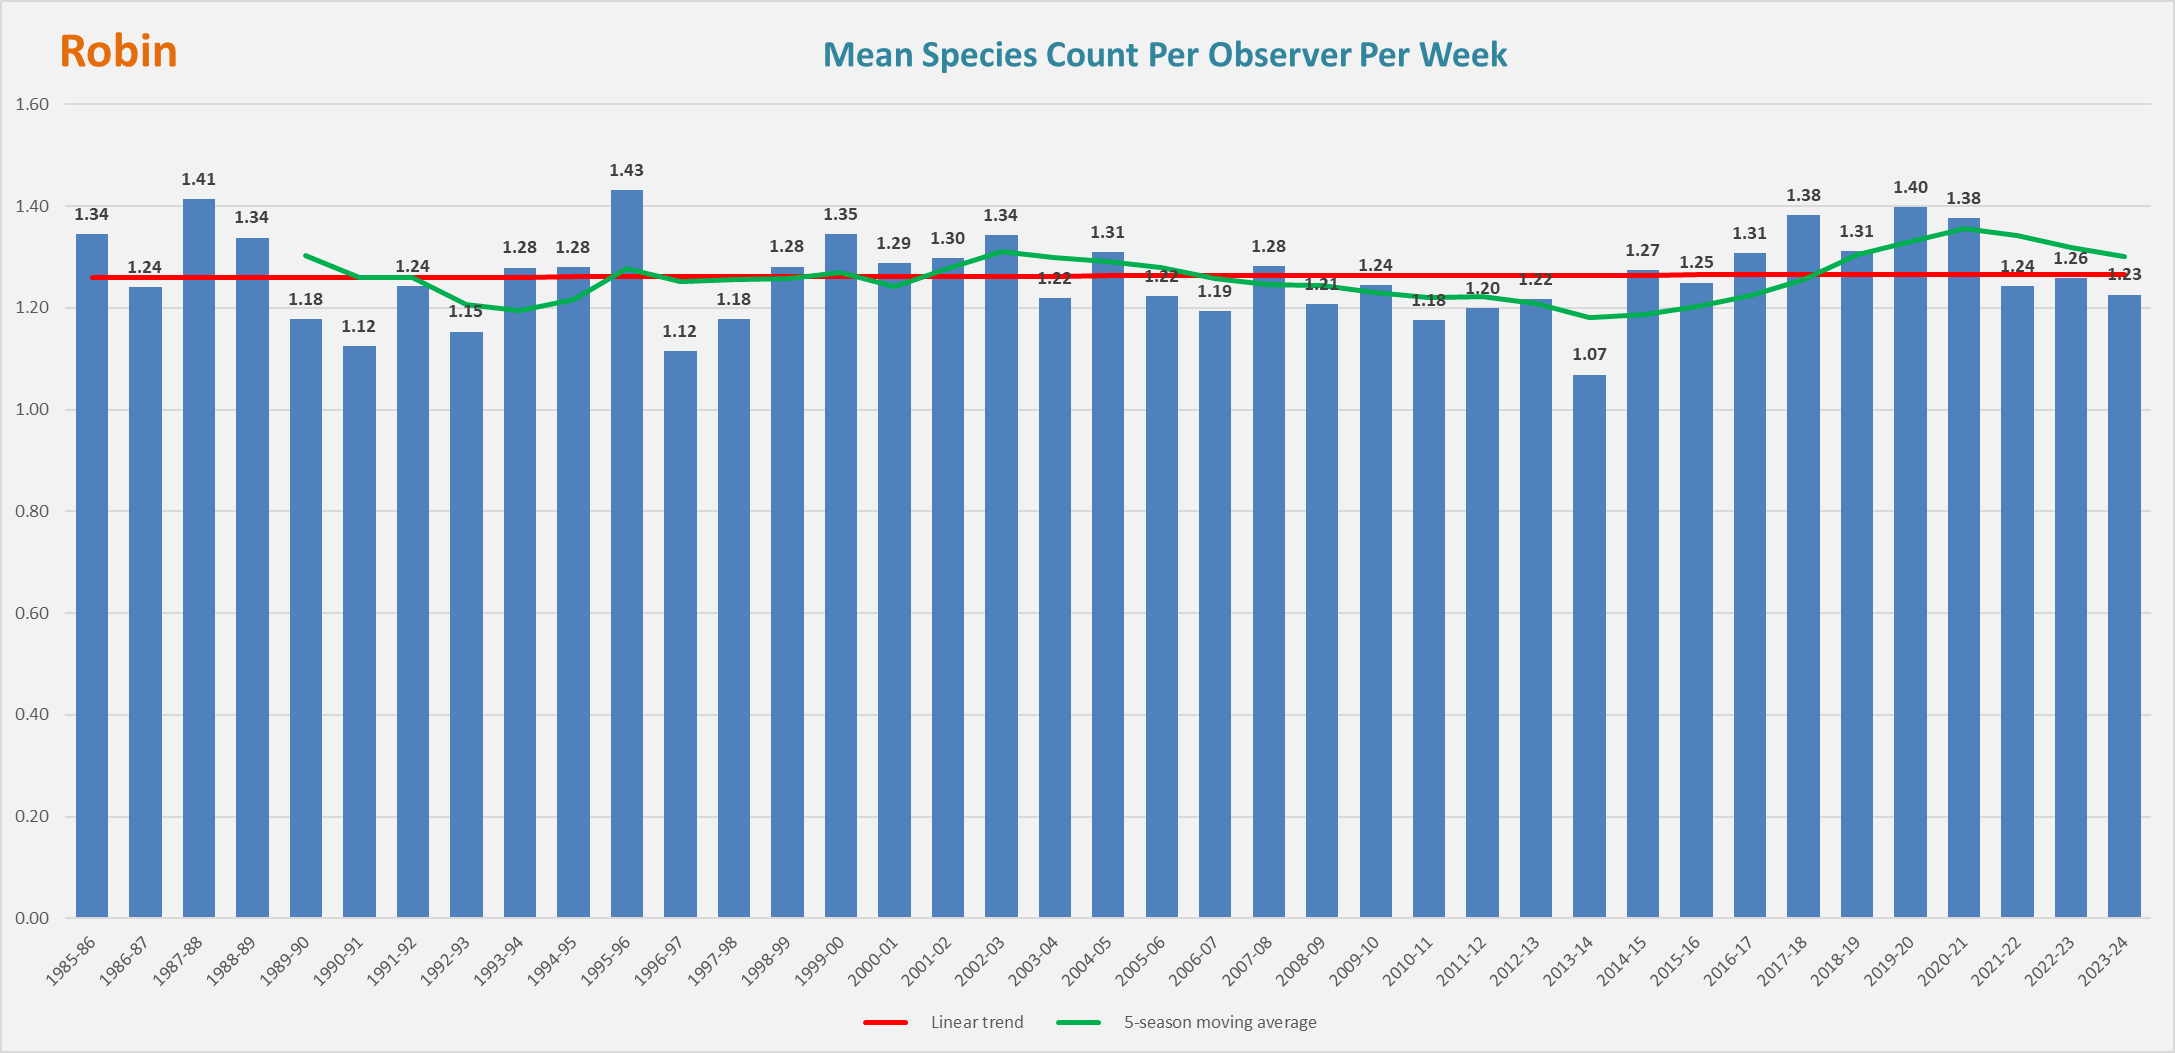
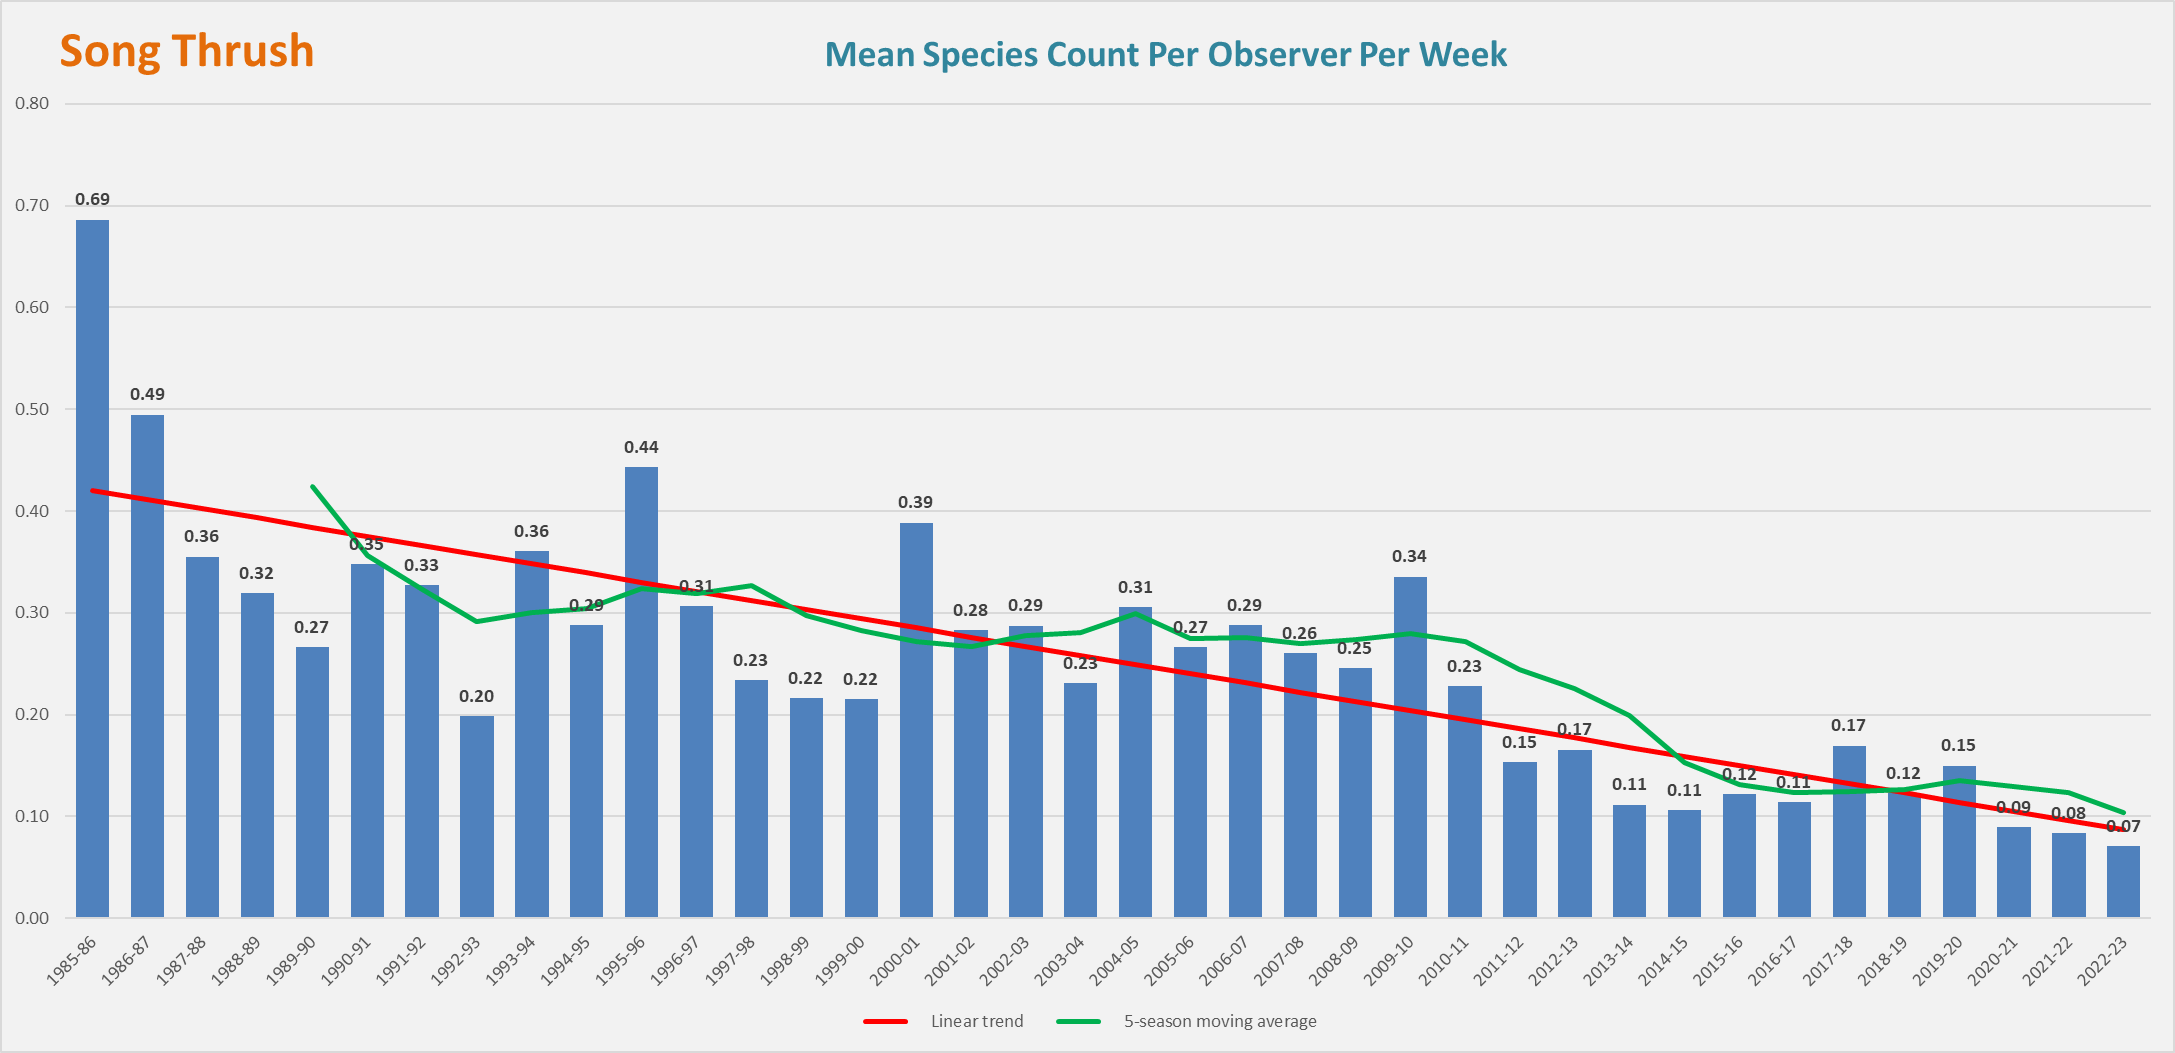
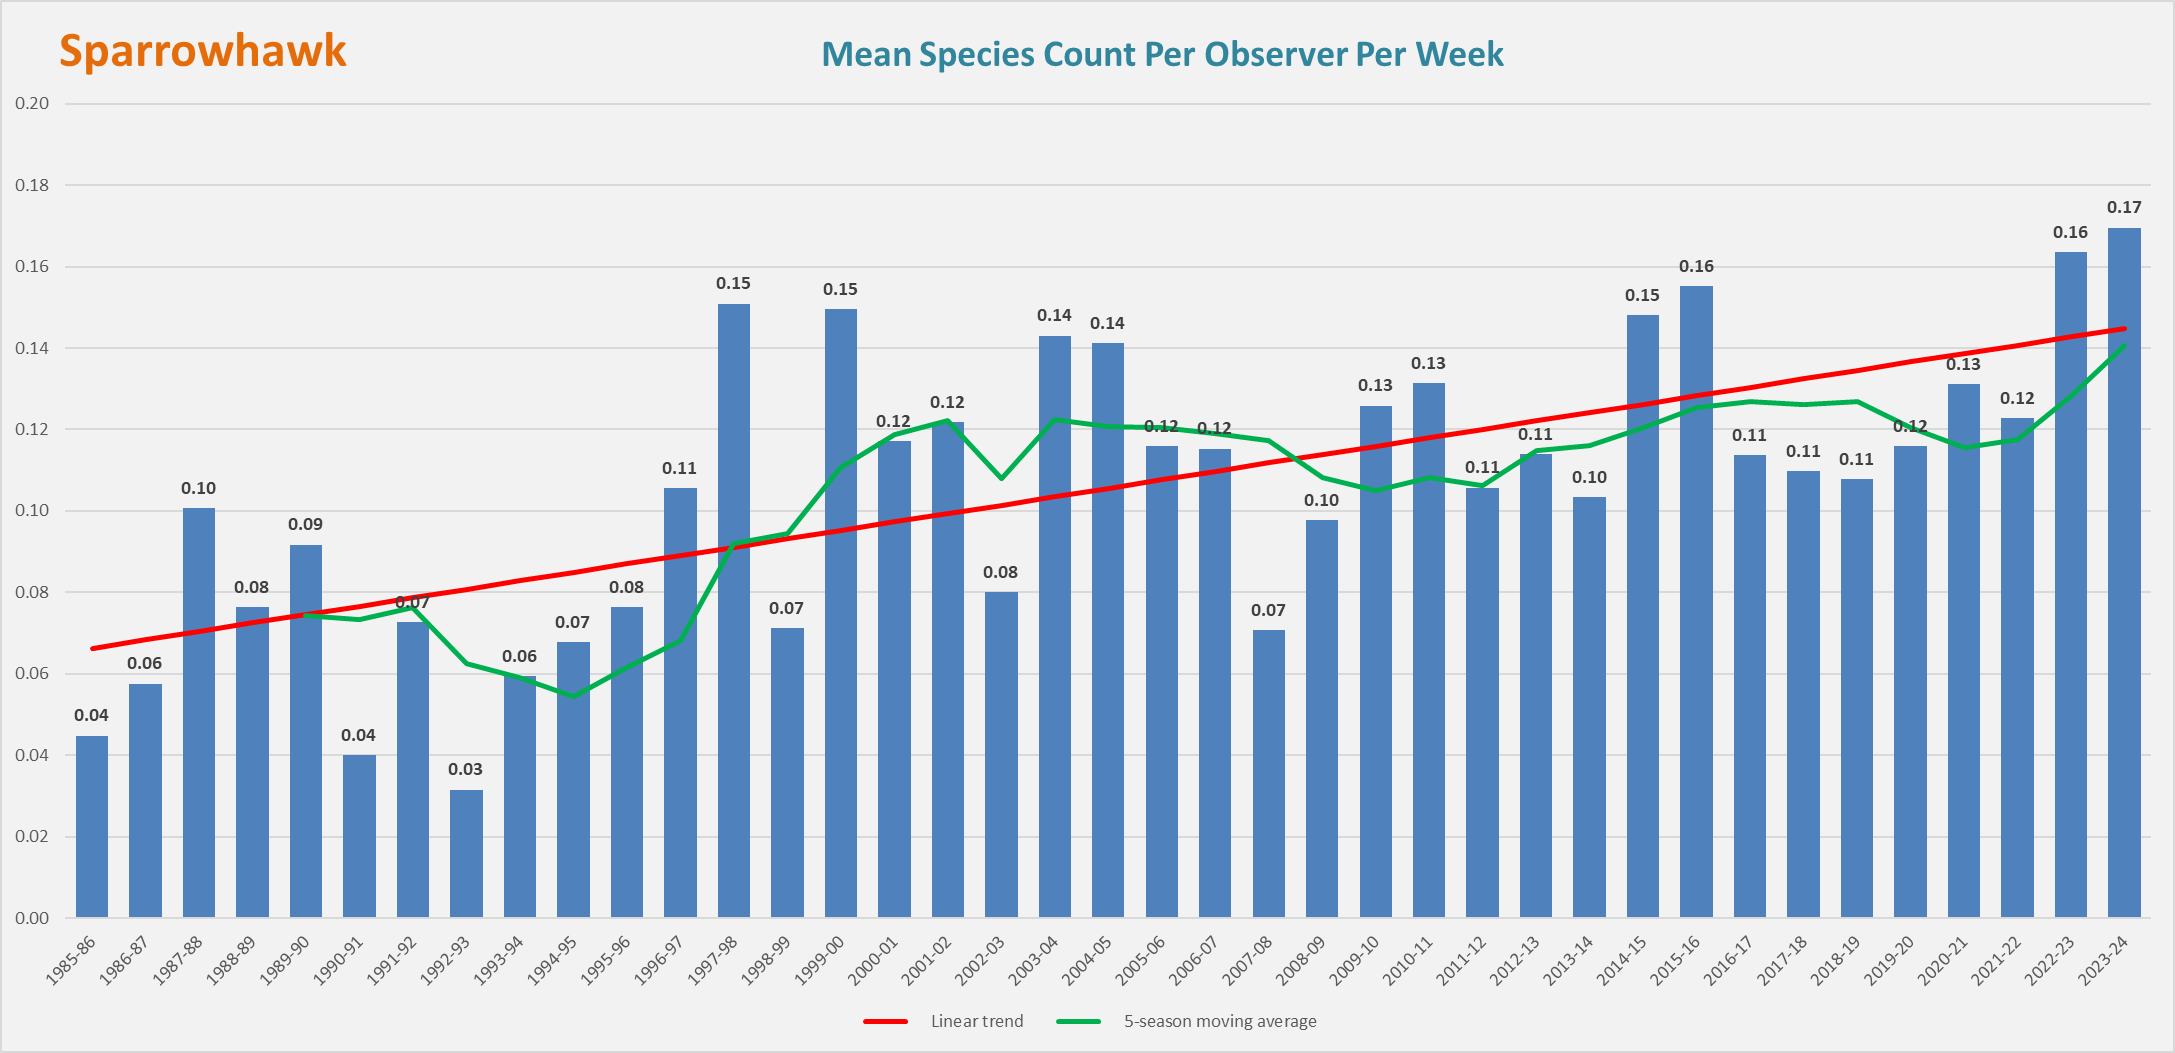
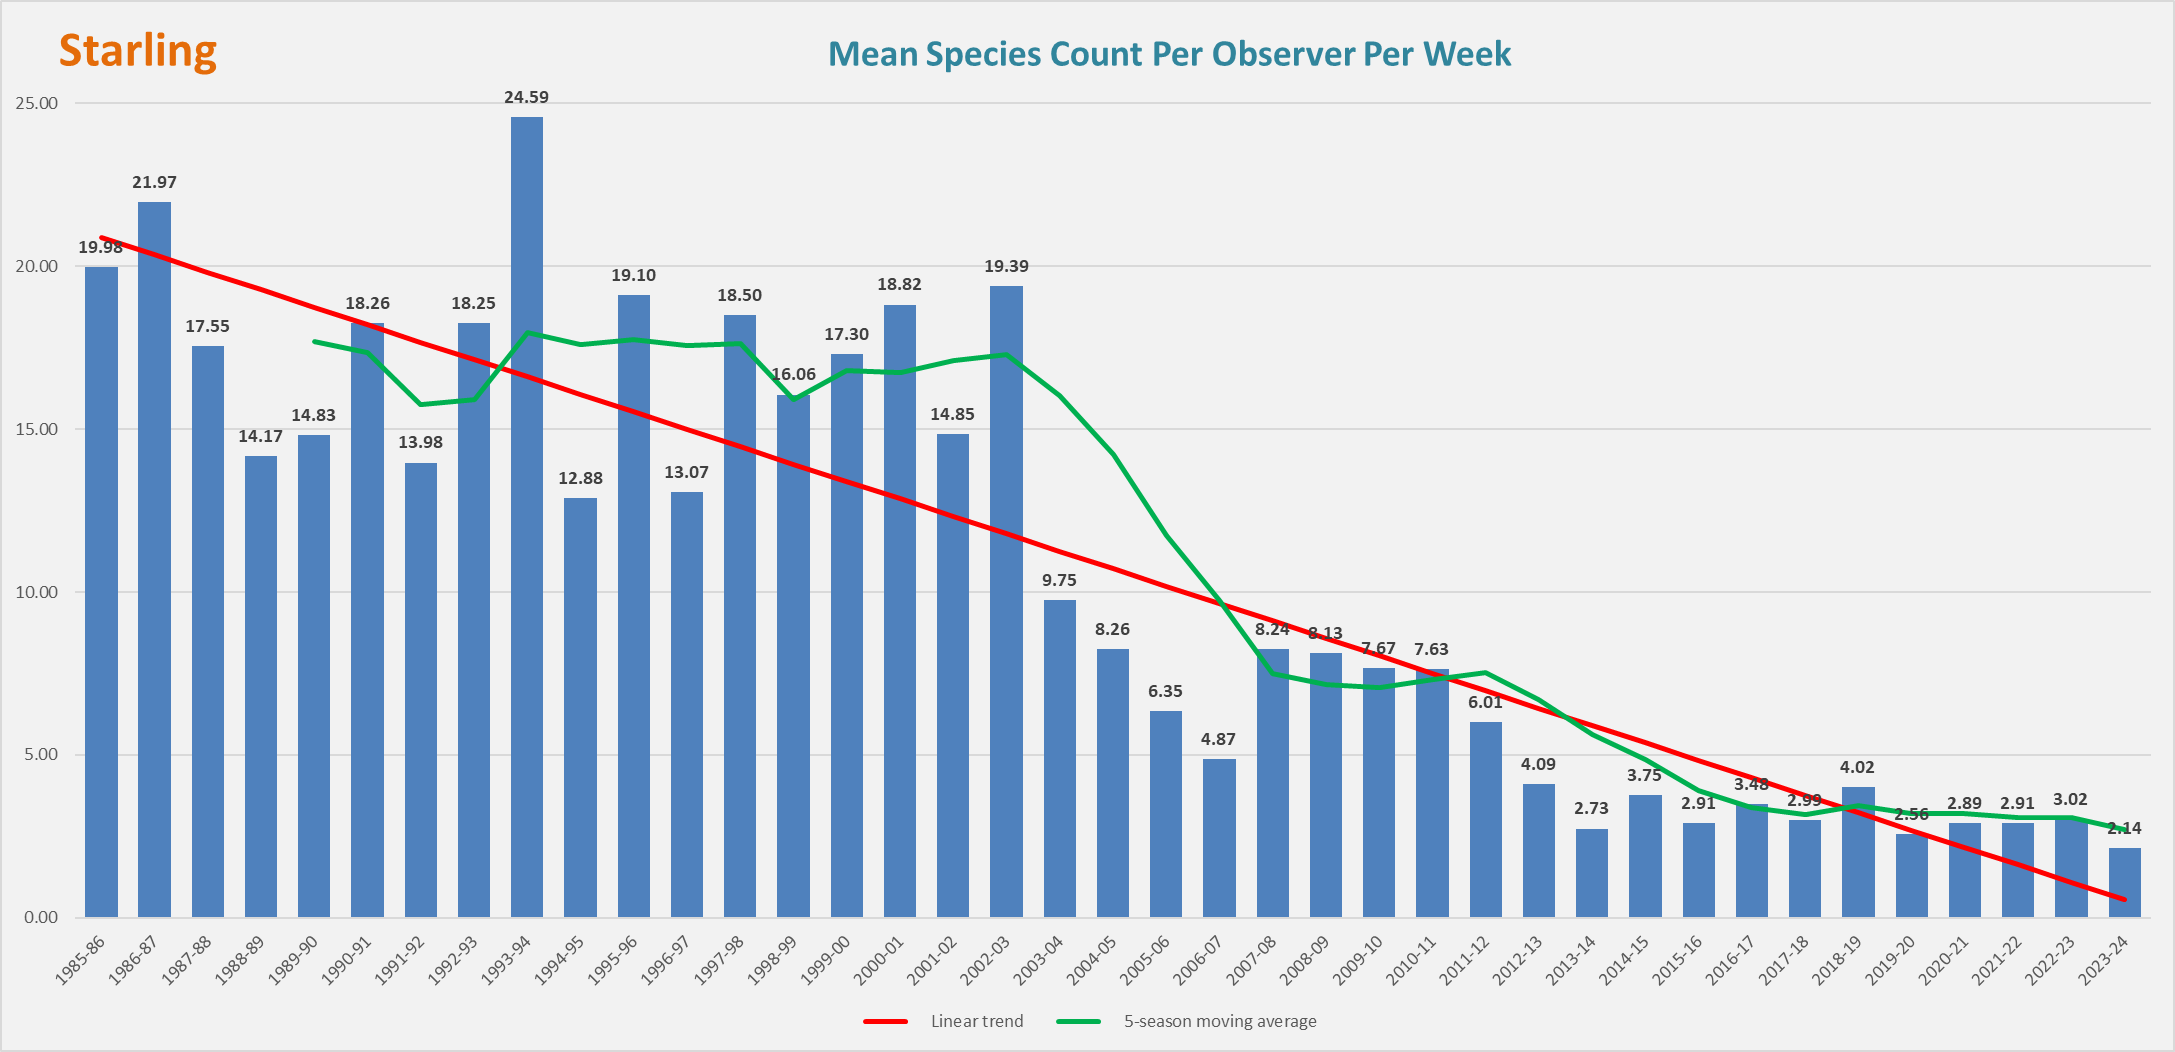
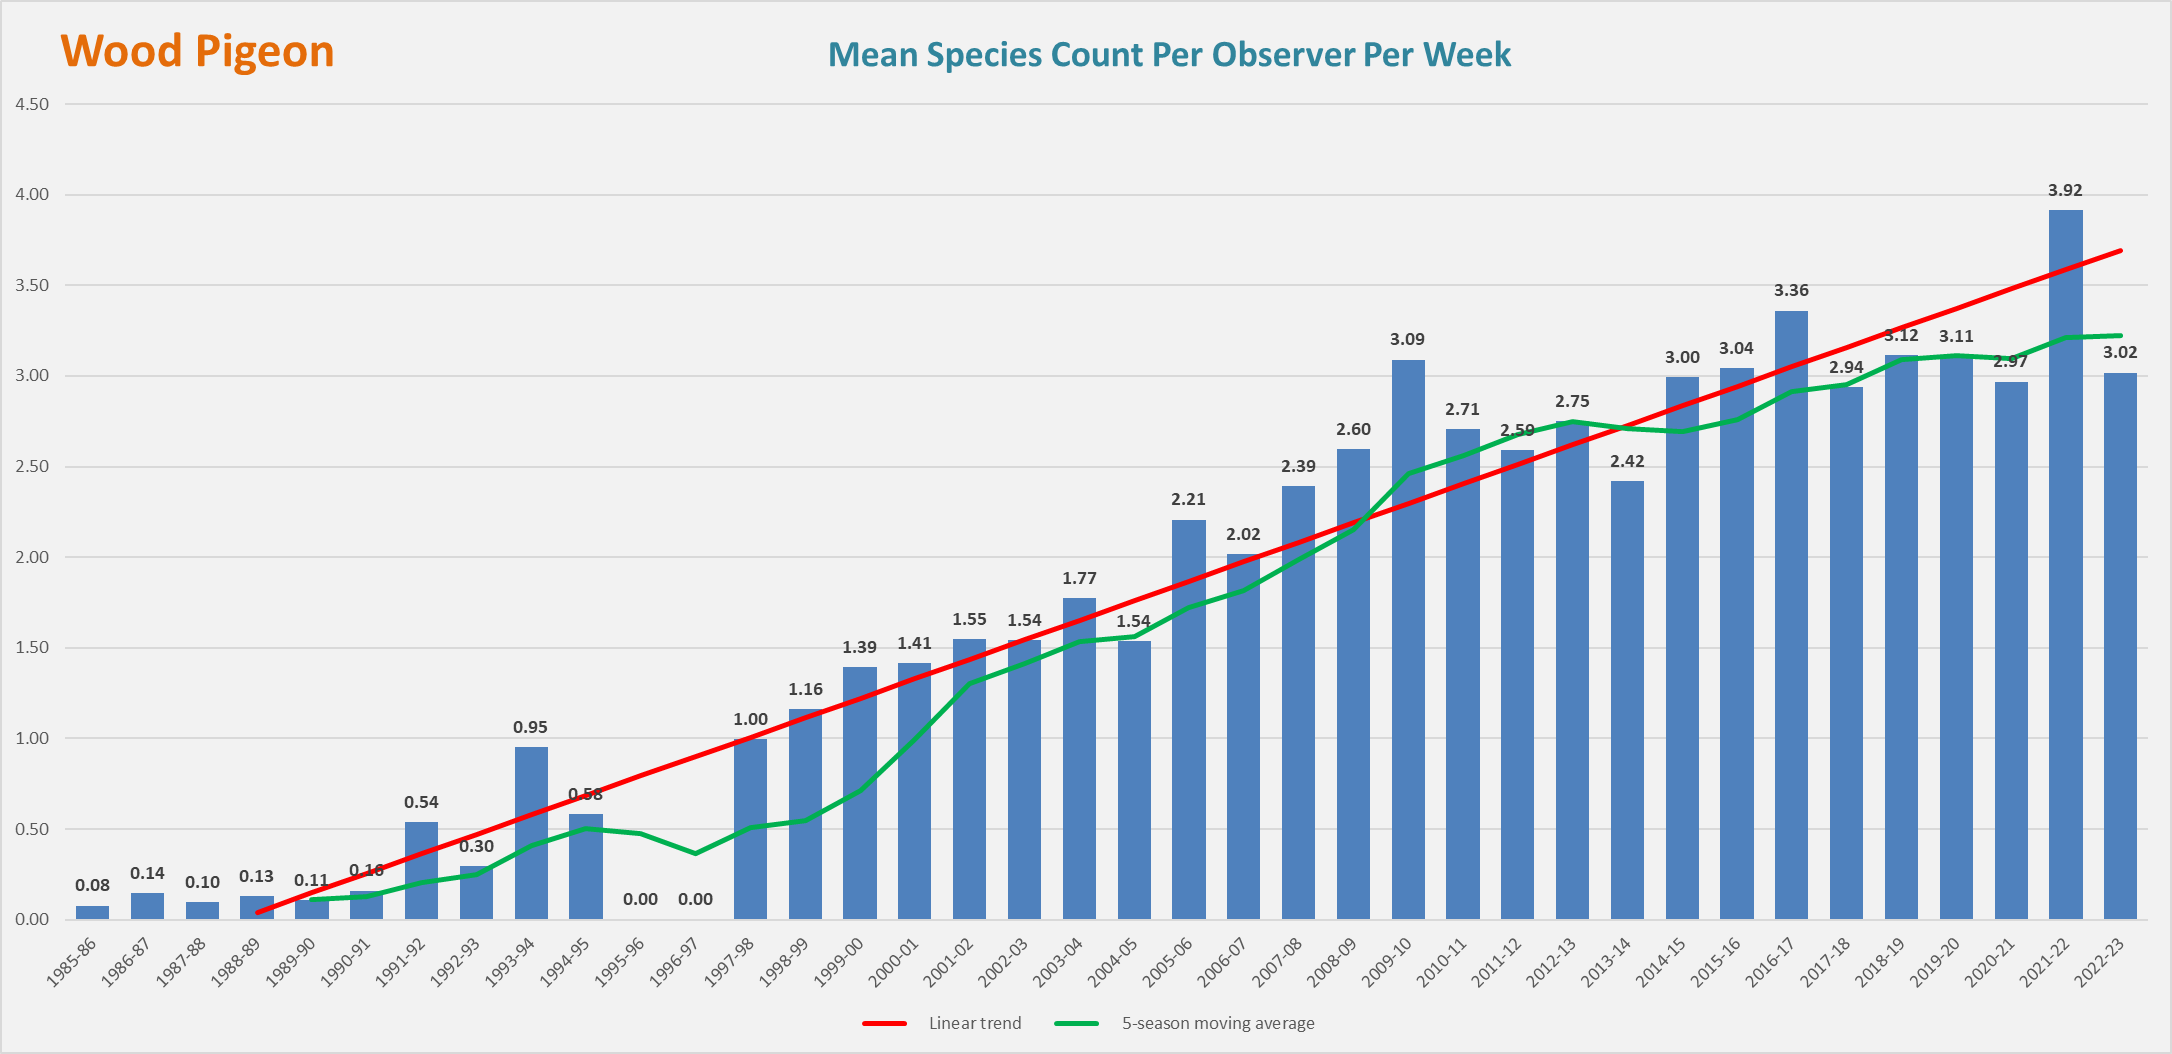
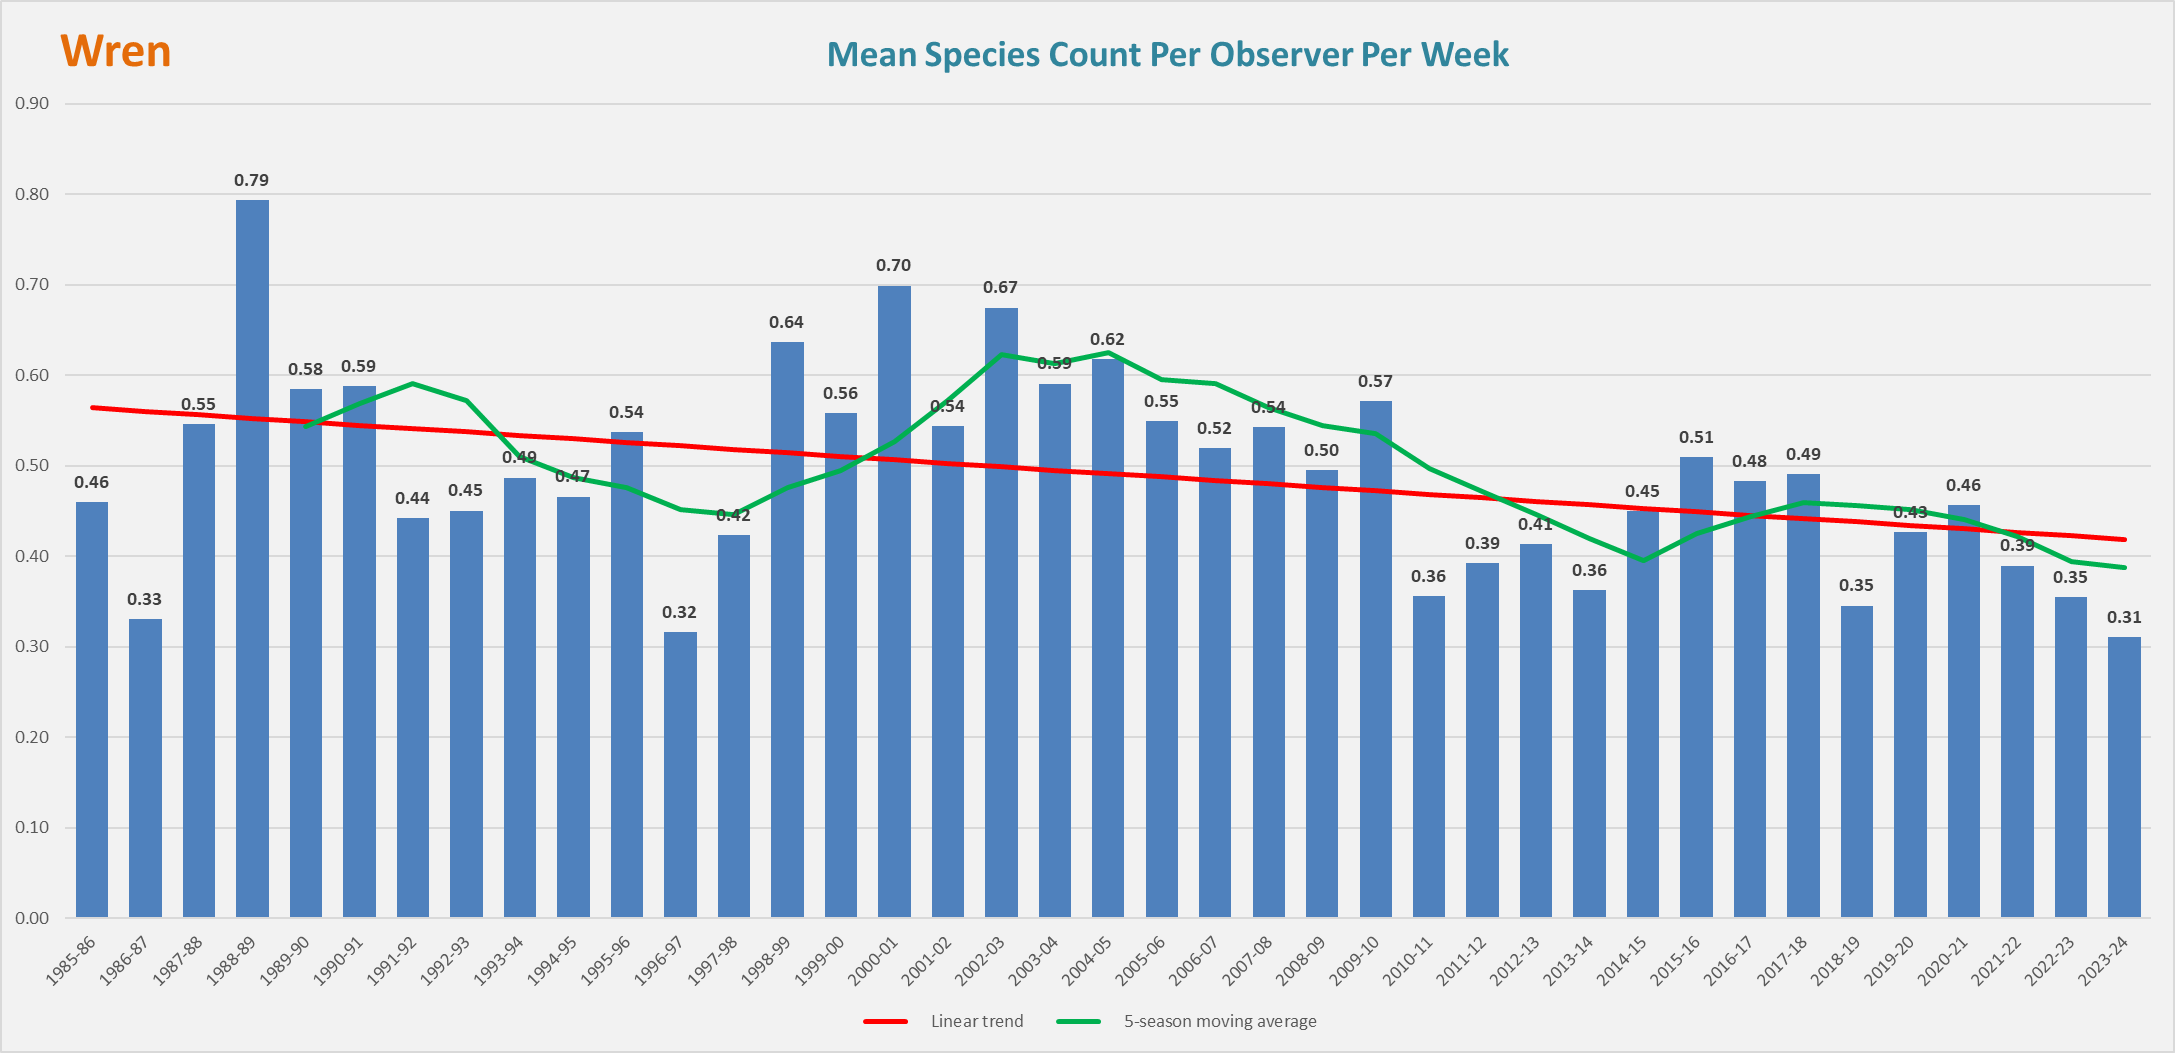
The results for the 22 most seen species are shown in the charts below.
Each chart contains three graphs:
- The blue bar graph shows the mean maximum number of birds seen by observers during each season. The values are shown above the bars.
- The red 'linear trendline' is a best-fit straight line through the data. It shows the overall trend through the survey period.
- The green '5-season moving average' line shows short-term changes in the data that are masked by the 'linear trendline'.
More information is available in our Winter Garden Bird Survey Notes
Thumbnail images can be opened in larger view by using Right Click from your PC and selecting 'Open Image in New Tab' or by pinch in and pinch out on your touch screen tablet
